
This is the tenth article in our series on data quality problems for process mining. You can find an overview of all articles in the series here.
Last week, we were looking at missing activities and missing timestamps. Today, we will discuss another common data quality problem that I am sure most of you will encounter at some point in time in the future.
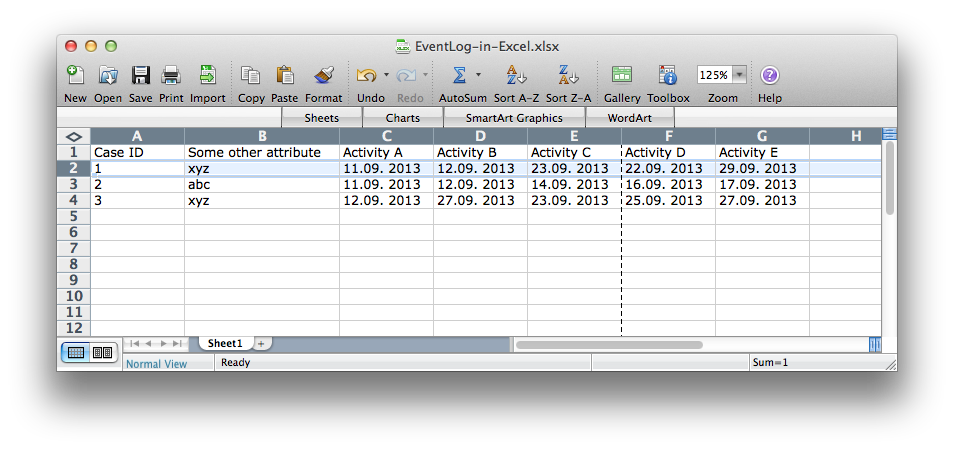
Take a look at the following data snippet (you can click on the image to see a larger version). In this data set, you can see three cases (Case ID 1, 2, and 3). If you compare this data set below with a typical process mining data set, you can see the following differences:
-
There is just one row per case (see case 1 highlighted). Normally, you would have multiple rows – One row for each event in the case.
-
The activities are in columns (here, activity A, B, C, D and E), with the dates or timestamps recorded in the cell content.
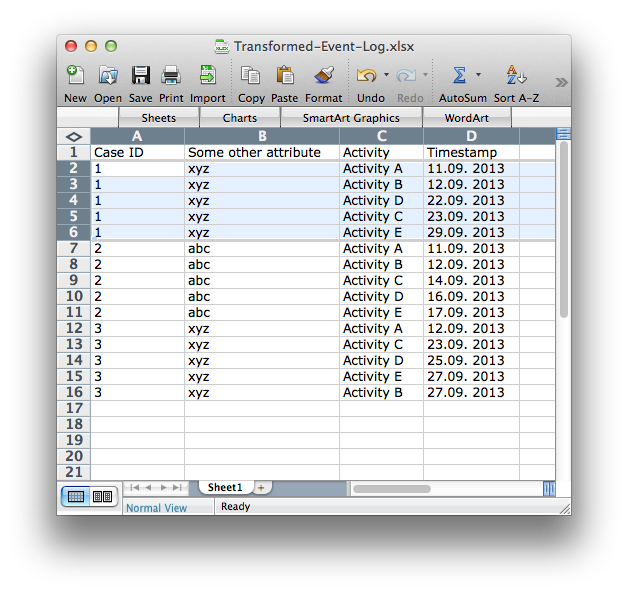
When you encounter such a data set, you will have to re-format it into the process mining format in the following way (see screenshot below):
-
Add a rows for each activity (again, case 1 is highlighted).
-
Create an activity and a timestamp column to capture the name and the time for each activity.
However, the important thing to realize here is that this is not purely a formatting problem. The column-based format is not suitable to capture event data about your process, because it inherently loses information about activity repetitions.
For example, imagine that after performing process step D the employee realizes that some information is missing. They need to go back to step C to capture the missing information and will only then continue with the proces step E. The problem with the column-based format as shown in the first data snippet is that there is no place where these two timestamps regarding activity C can be captured. So, what happens in most situations is that the first timestamp of activity C is simply overwritten and only the latest timestamp of activity C is stored.
You might wonder why people store process data in this column-based format in the first place. Typically, you find this kind of data in places, where process data has been aggregated. For example, in a data warehouse, BI system, or an Excel report. It’s tempting, because in this format it seems easy to measure process KPIs. For example, do you want to know how long it takes between process step B and E? Simply add a formula in Excel to calculate the difference between the two timestamps.1
People often implicitly assume that the process goes through the activities A-E in an orderly fashion. But processes are really complex and messy in reality. As long as the process isn’t fully automated, there is going to be some rework. And by pressing your data in such a column-based format you lose information about the real process.
So what can you do if you encounter your data in such a column-based format?
How to fix:
First of all, you should use the data that you have and transform it into a row-based format like shown above. However, in the analysis you need to be aware about the limitation of the data and know that you can encounter some distortions in the process because of it (see an example below).
If the process is important enough, you might want to go back in the next iteration and find out where the original data that was aggregated in the BI tool or Excel report comes from. For example, it might come from an underlying workflow system. You can then get the full history data from the original system to fully analyze the process with all its repetitions.
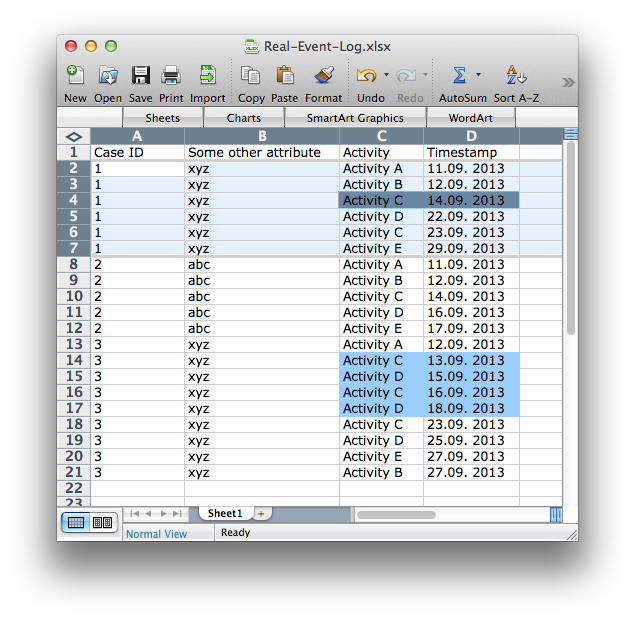
To understand what kind of distortions you can encounter, let’s take a look at the following data set, which shows the steps that actually happened in the real process before the data was aggregated into columns. You can see that:
-
Only case 2 followed the expected path A-E.
-
In case 1 and in case 3 rework occurred that is simply lost in the column-based, and then the transformed, data set (see blue mark-up).
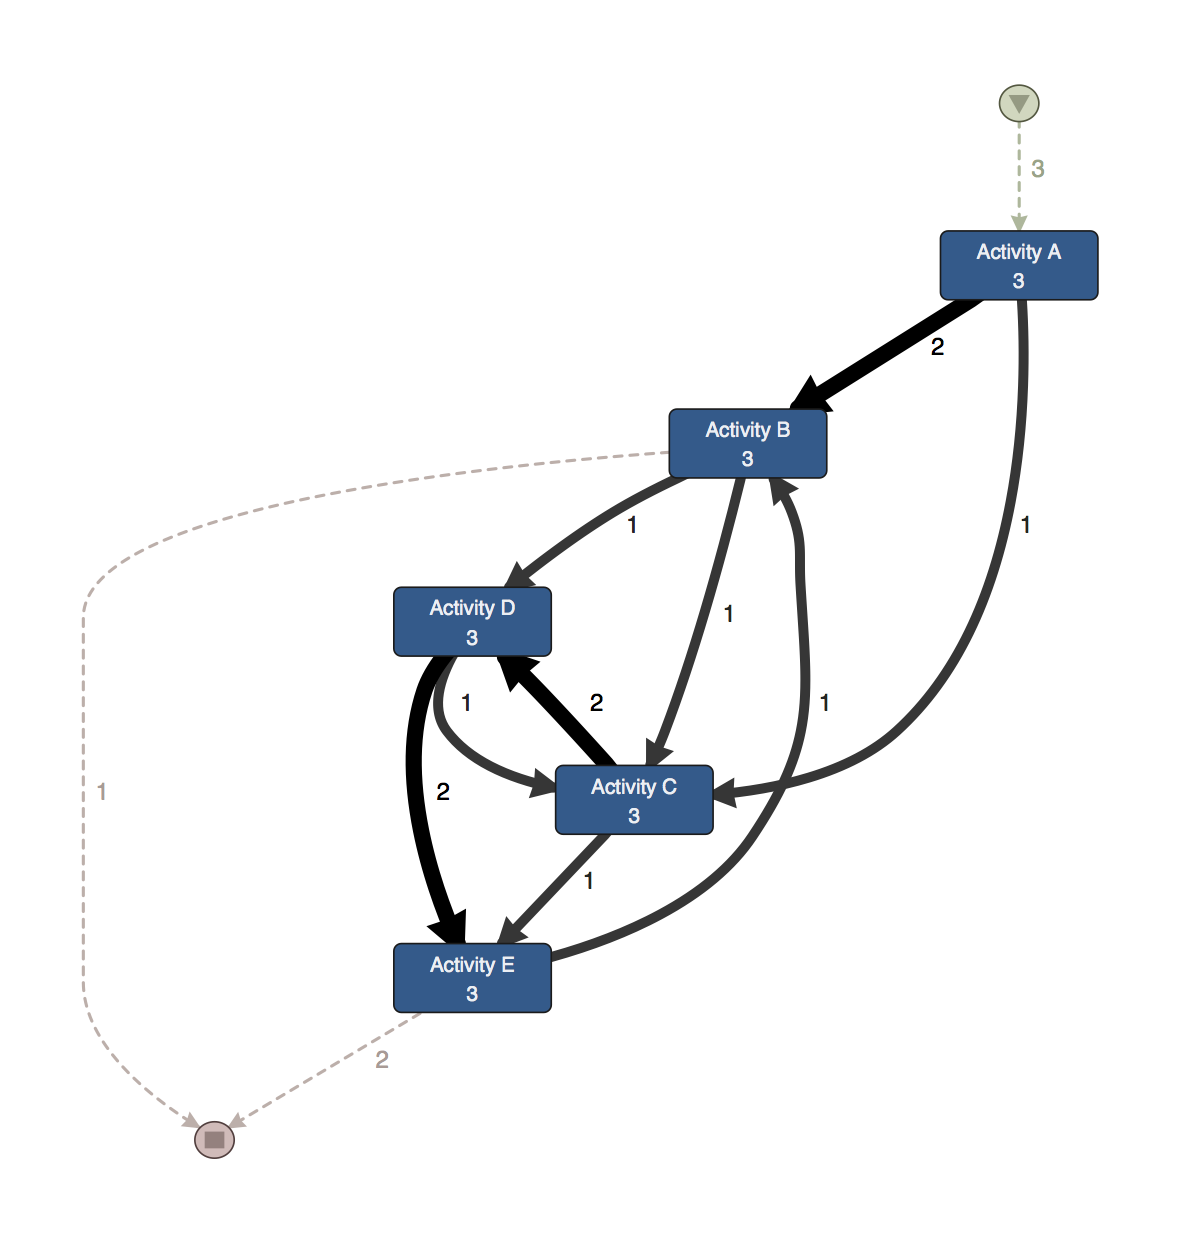
Now, when you first import the data set that was transformed from the column-based format to the row-based format into Disco, you get the following simplified process map (see below).

The problem is that if a domain expert would look at this process map, they might see some strange and perhaps even impossible process flows due to the distortions from the lost activity repetition timestamps. For example, in the process map above it looks like there was a direct path from activity B to activity D at least once.
However, in reality this never happened. You can see the discovered process map from the real data set (where all the activity repetitions are captured) below. There was never a direct succession of the process steps B and D, because in reality activity C happened in between.

So, use the data that you have but be aware that such distortions can happen and what is causing them.
The process maps above were simplified process maps (see this guide on simplifying complex process models to learn more about the different simplification strategies). If you are curious to see the full details of each map to make sure there was really no path from activity B to activity D, you can find them below:
-
Left: The full process map that was discovered from the column-based and transformed data set (click on the image to see a larger version)
-
Right: The full process map for the real process (click on the image to see a larger version).

-
Another danger of this approach is that if the two steps are not in the expected order, you will actually end up with a negative duration. ↩︎

Anne Rozinat
Market, customers, and everything else
Anne knows how to mine a process like no other. She has conducted a large number of process mining projects with companies such as Philips Healthcare, Océ, ASML, Philips Consumer Lifestyle, and many others.