
This is the 6th article in our series on typical process mining data preparation tasks. You can find an overview of all articles in the series here.
Out of the three minimum data requirements for process mining, the activity name is crucial to visualize the steps in the process. It shows you which activities took place and in which sequence.
There are situations, in which the activity name is only captured on a very technical level by the IT system (e.g., as an action code, a transaction number, or some other cryptic label). This is a problem. Not only because it makes it difficult for business users to understand the process map, but also because it becomes close to impossible for the process mining analyst to interpret what they are seeing. Therefore, we recommend to always take the time to enrich such technical activity labels by human-readable activity names.
For example, take a look at the following data set extracted by a Brazilian IT Service Management department (see below). The ’task sequence’ column represents the status changes of the tickets in the IT Service Management system.

When you import the data into Disco to discover the process map1, you find that the activity names are shown as numbers (see below). For example, the first activity at the top is shown as ‘10’, the second one as ‘20’, etc. (click on the process map to see a larger version).
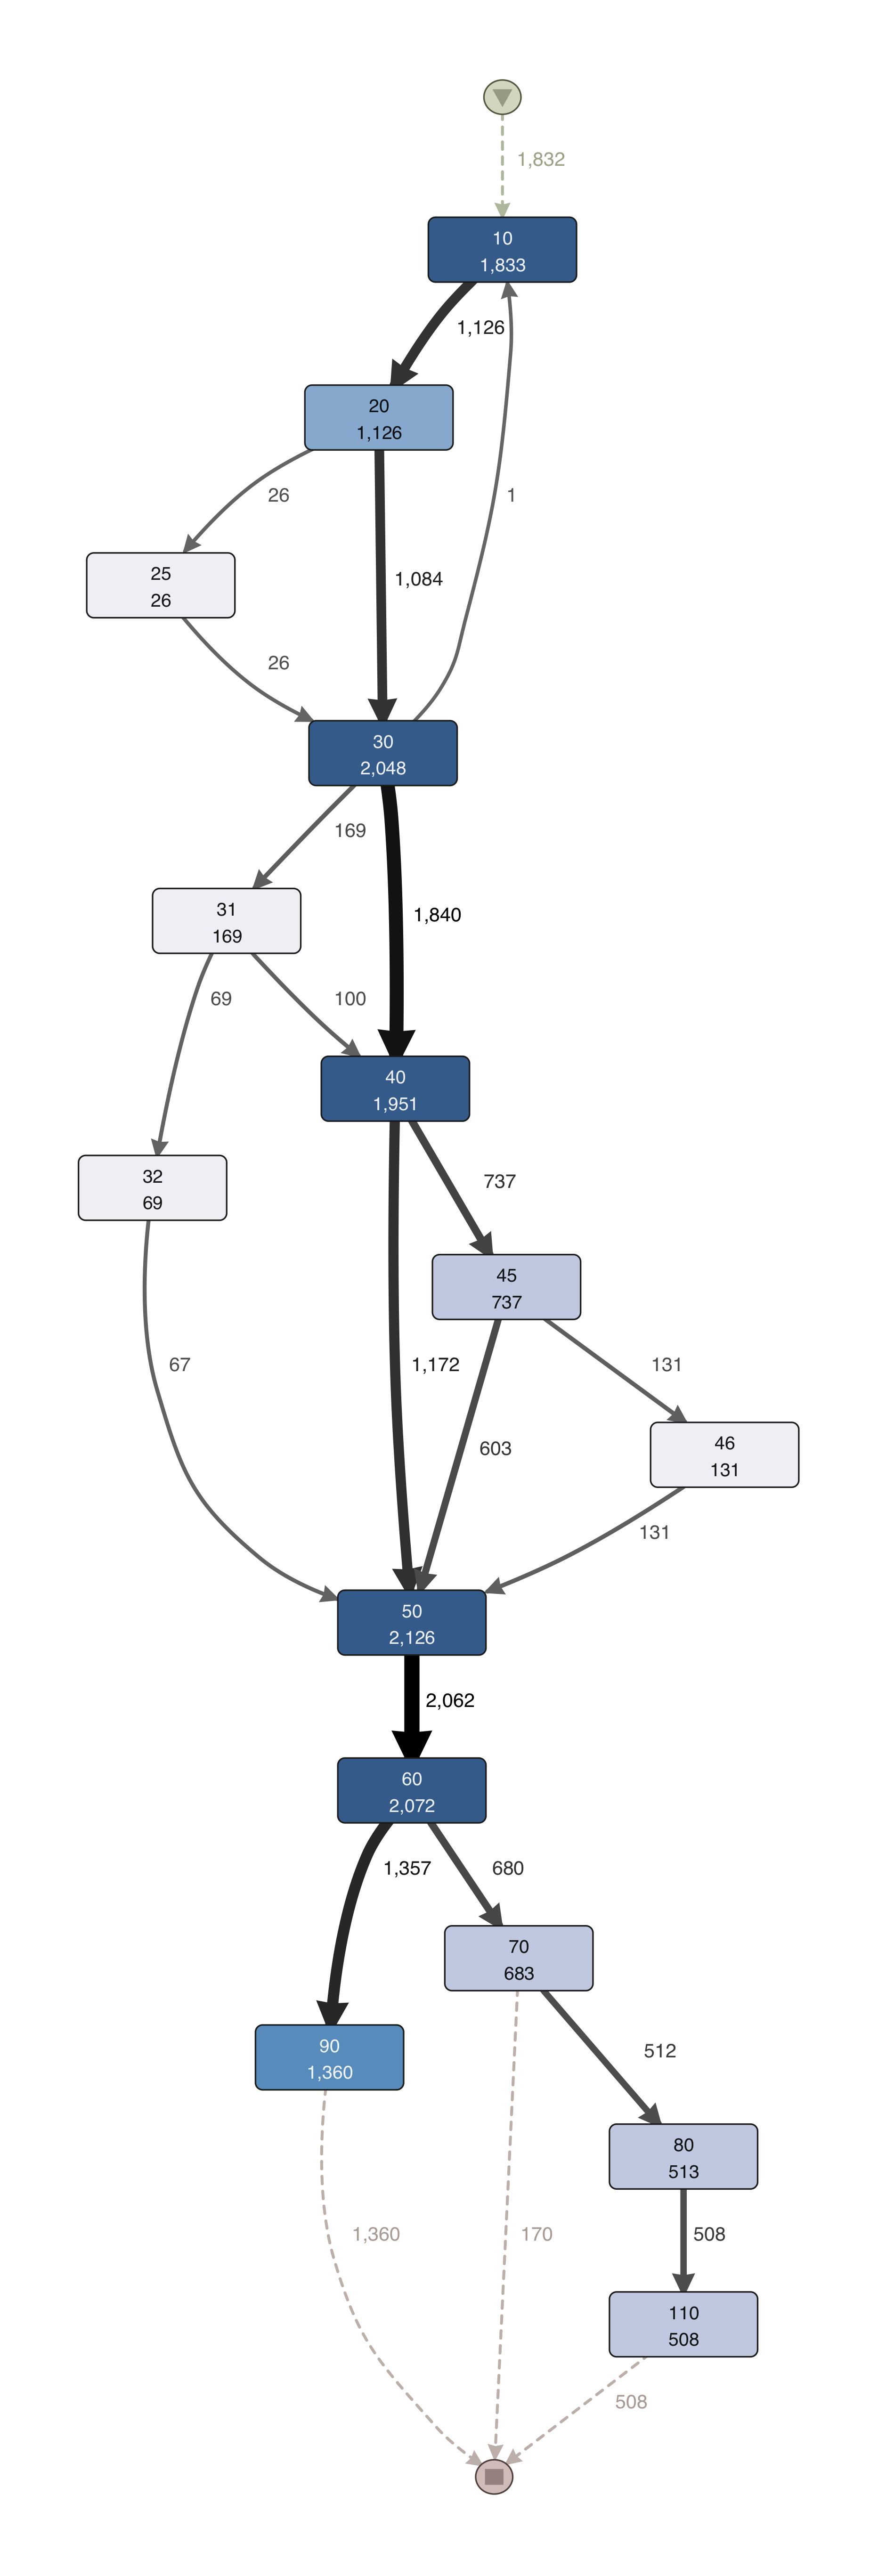
This is not practical, because—unlike you are so familiar with the IT system that you “think in” task sequence codes yourself—you will have a hard time to understand and interpret this process.
Even having a translation table on your desk and looking up individual activities (to see which activity belongs to which status code) is not a good idea, because the process maps that you discover with process mining get complicated very quickly already by themselves. You need to be able to build up a mental model of the process to deal with this complexity in your analysis.
So, in this article we show you step by step how you can add meaningful activity names to a data set that only has cryptic activity labels.
Step 1: Export the activities
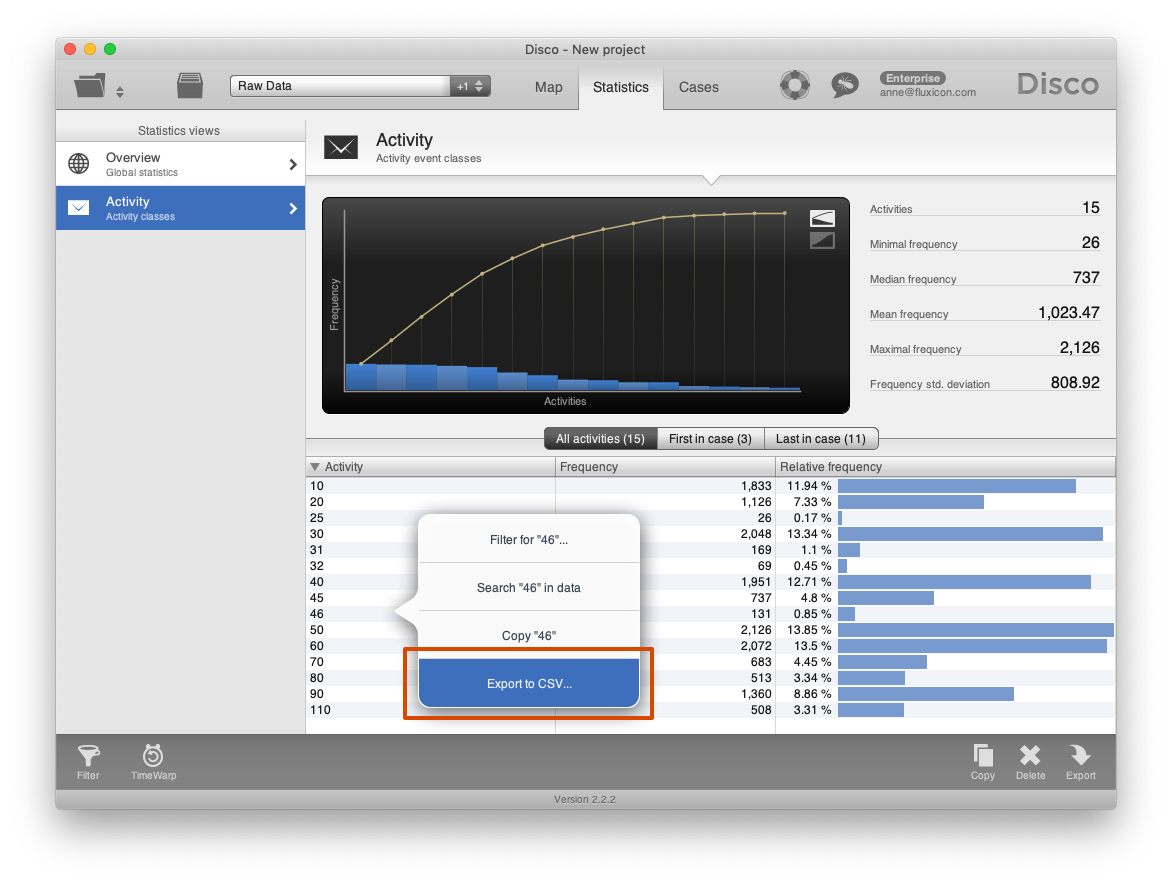
First, you can export the list of all the different activities that are contained in your data set. To do this, you can go to the ‘Activities’ view in the ‘Statistics’ tab in Disco. Simply right-click somewhere in the activity statistics table and use the ‘Export CSV…’ option to save the activity statistics as a CSV file (see below).
You can then open the exported file in Excel (see below).

The ‘Frequency’ and ‘Relative frequency’ statistics are not needed for this use case and you can delete those columns.
Step 2: Mapping the activities
In the next step, you can add a new column and give the Excel sheet to the IT administrator of the system from which you extracted the data. Ask them to add a short description for each of the technical activity labels in your list.
Alternatively, you can also fill in a meaningful activity name yourself by looking at example cases and the process map together with a domain expert.
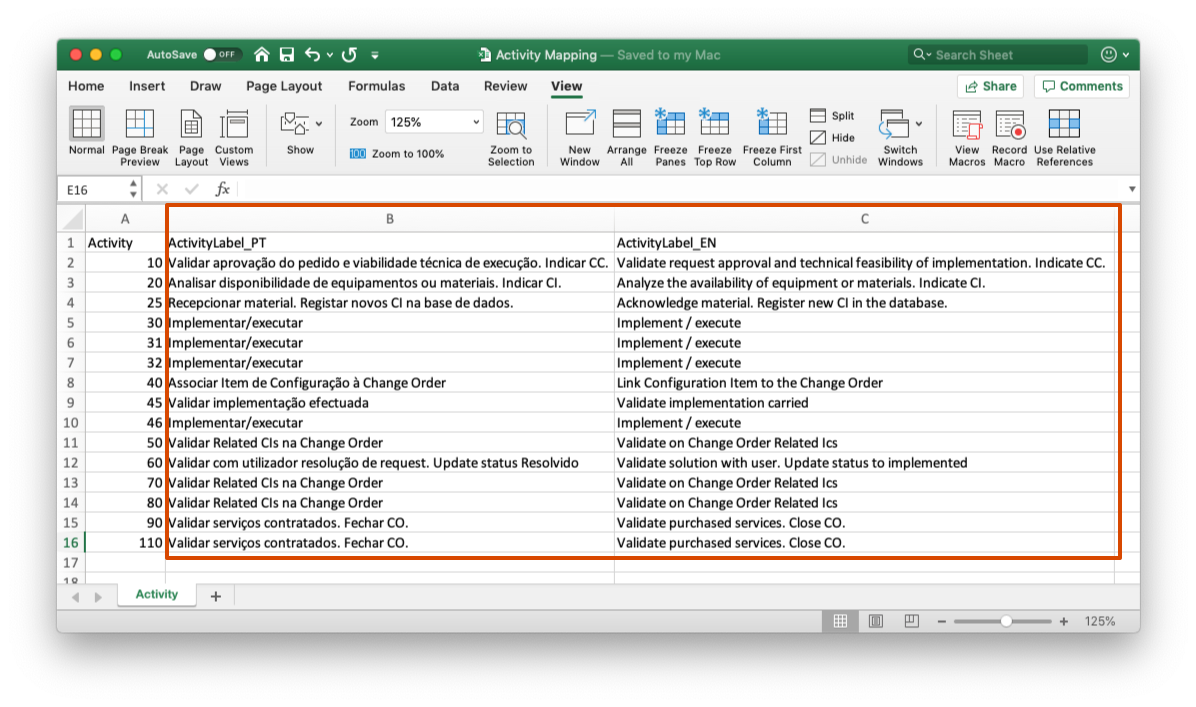
For example, for the IT Service Management process from before a column ‘ActivityLabel_PT’ has been added with the Portuguese and another column ‘ActivityLabel_EN’ for the the English activity name (see above).
Step 3: Apply the new mapping to your dataset
Now that we have the mapping, we need to apply it to the source data. Here, we show you two simple ways of how to do this in Excel. We will share alternative ways of relabeling activity names for data sets that are too large to be manipulated in Excel in an upcoming article.
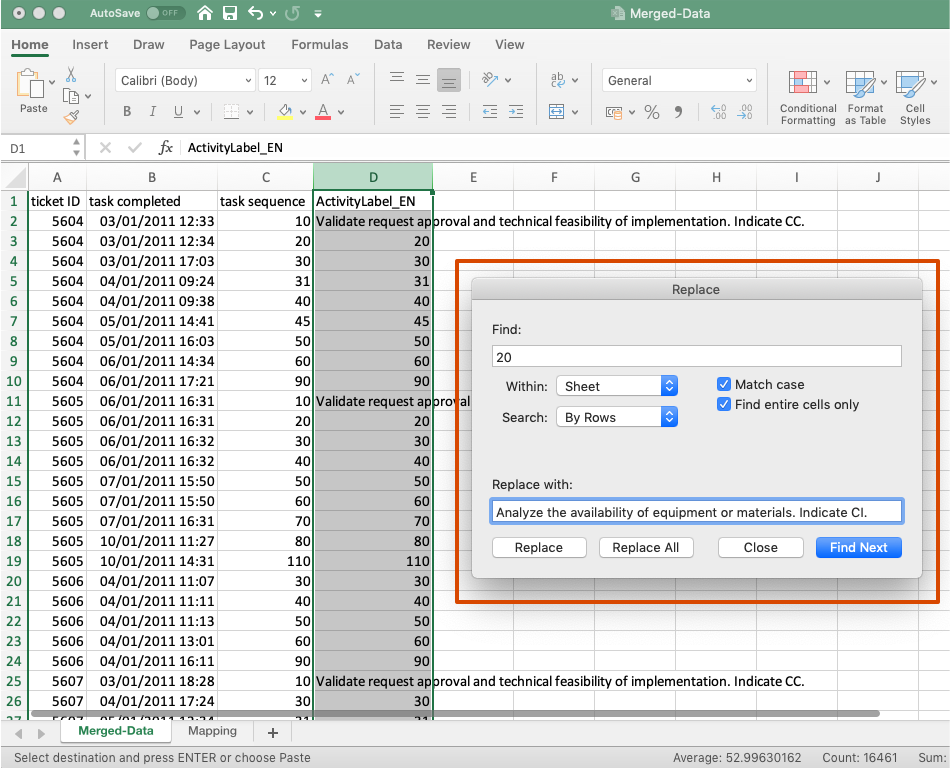
The easiest way is to just use the ‘Find and Replace’ functionality in Excel (see below).
- Copy and paste the column with the technical activity code. Choose a new heading for the new column to indicate that this is the new activity name.
- Select the new column (to make sure only fields in this column are being replaced) and open the ‘Find and replace’ tool in Excel.
- Don’t forget to check the find entire cells only options, otherwise you may only replace part of the text.
- Copy and paste the first technical activity code in the ‘Find’ and its new human-readable name in the ‘Replace with’ field.
- Press ‘Replace All’.
- Continue until all technical activity codes in the new column have been replaced.
The ‘Find and Replace’ method becomes a bit tedious if you have a large number of different activities. In such situations you can better use the VLOOKUP function in Excel.2
To do this:
- Add a new tab called ‘Mapping’ to the source Excel file and copy the result from Step 2 above (without headings) to this new tab.
- Then, go back to your source data tab and add a new column including a heading for the relabeled activity.
- Add the following formula =VLOOKUP(C2,Mapping!A:C,2,FALSE) in the first cell of the newly created column.
- You can then automatically apply this formula to all the rows in the new column by double-clicking on the bottom right corner of this cell.
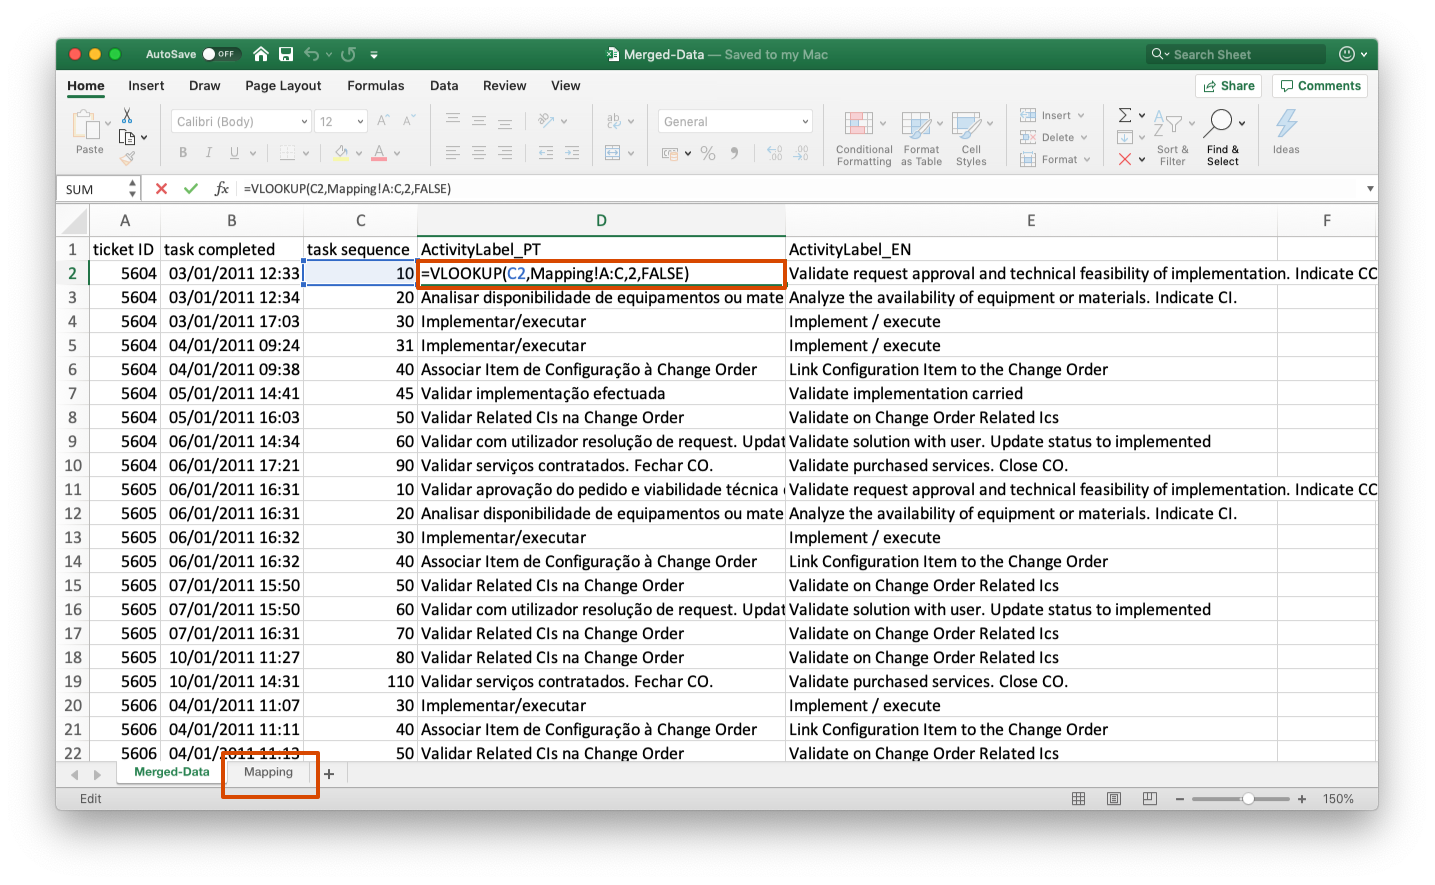
In the screen above both the Portuguese as well as the English activity names have been added to the data in this way.
Step 4: Import the data with the new label
Now, you can save the result from the previous step as a CSV file from Excel and import the CSV file into Disco.
For the IT Service Management data set we can choose whether we want to see the Portuguese or the English activity names in the process map (see below).
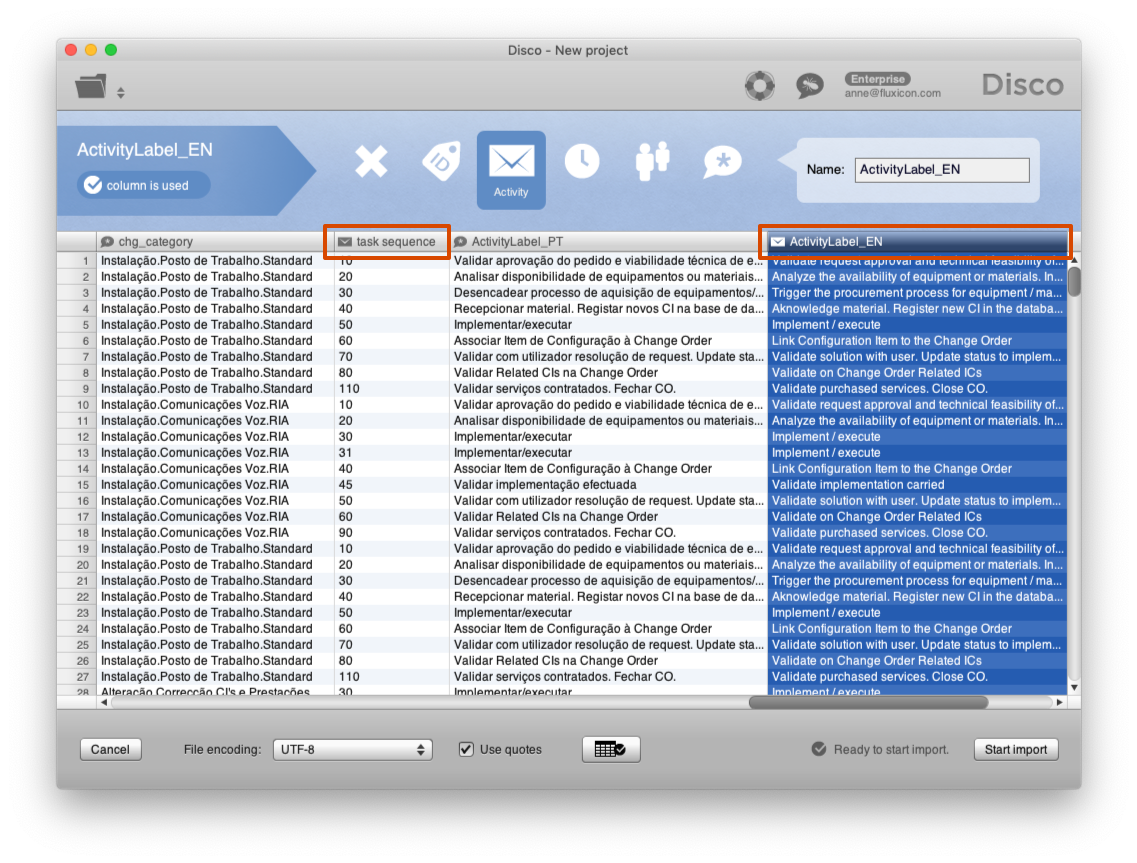
You can still also use the technical activity label as the activity name if you want to. To do this, simply configure both columns as ‘Activity’ during the import step. For example, in the screen above we have included both the ’task sequence’ column as well as the ‘ActivityLabel_EN’ column into the activity name.
The resulting process map contains activity names with the combination of both column values as shown below.
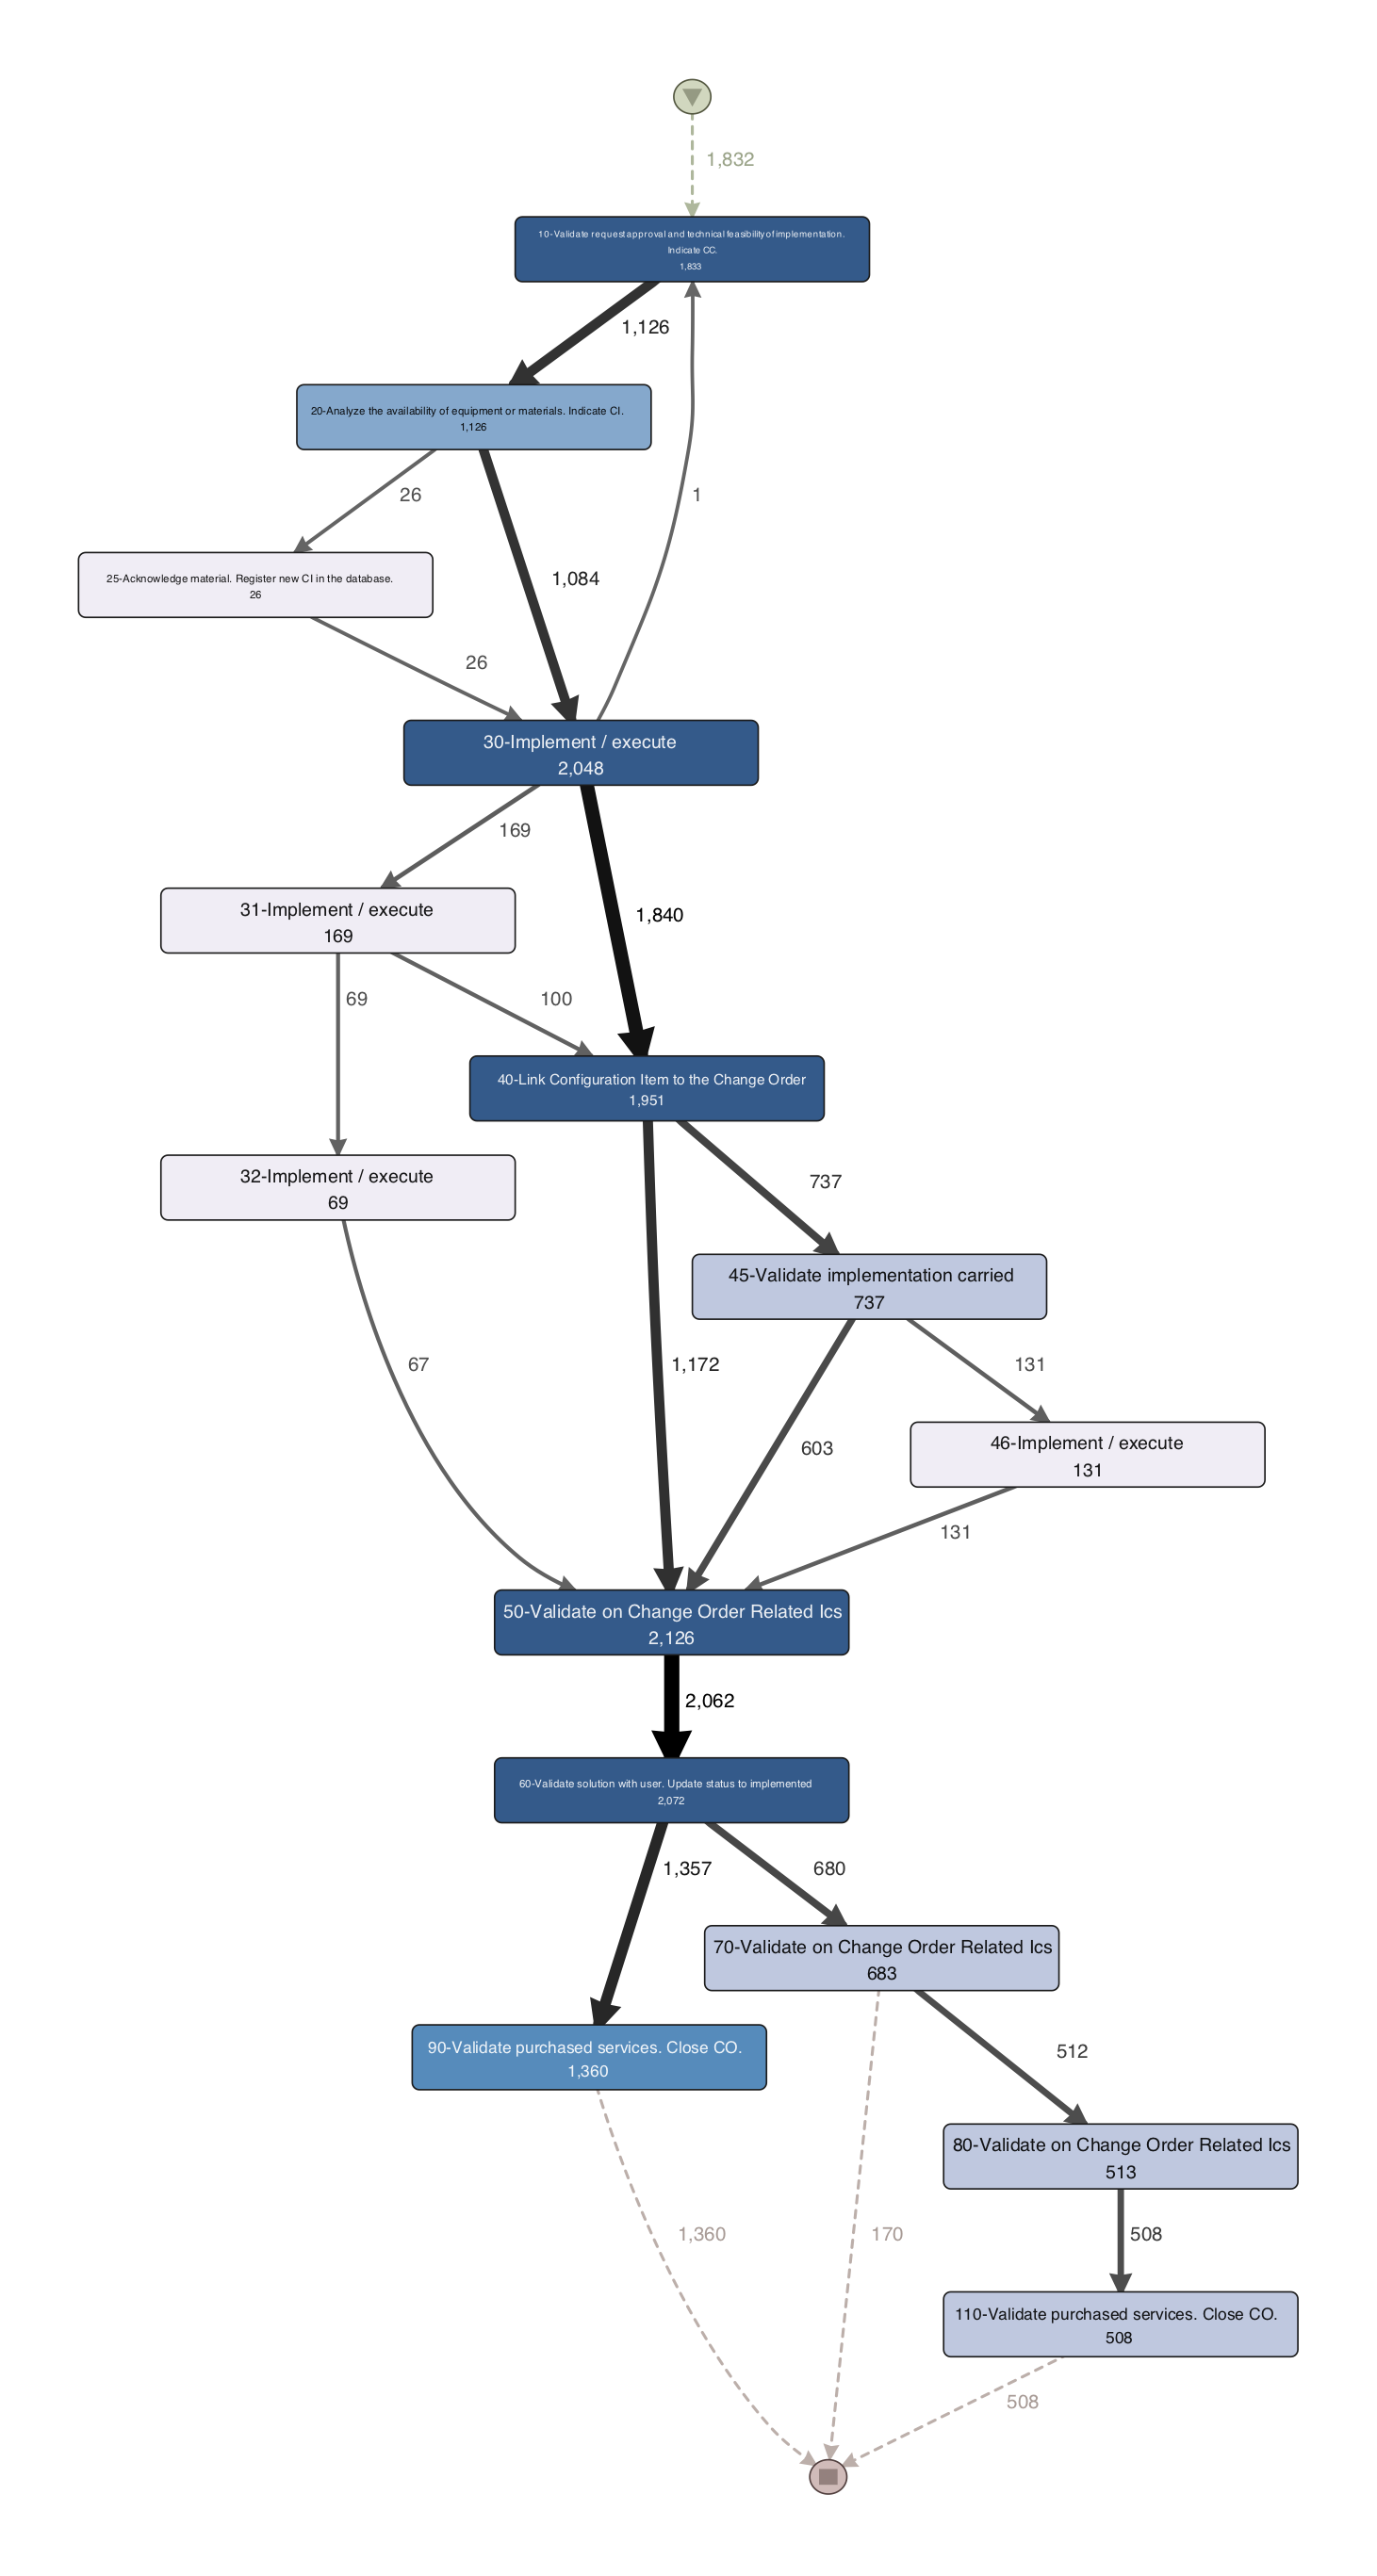
Finally, validate if your process after the mapping is the same as before. The relabeling should not change the process itself (just the names of the activities).
For example, the process map above is exactly the same as the one that we got in the very beginning. The only difference is that we have now meaningful activity names displayed in the process map.
-
Note that the process map has been simplified and, therefore, the numbers do not add up to 100%. You can learn more about when and how complex process maps can be simplified in our guide on Simplification Strategies for Process Mining. ↩︎
-
The VLOOKUP method also has the advantage that you can create more complicated mappings. For example, the original IT Service Management data set from this example actually had different activity names for the same task sequence codes depending on the IT Service Category. In such a situation, you can define the mapping as a combination of fields rather than a 1:1 mapping. ↩︎

Rudi Niks
Process Mining and everything else
Rudi has been a process mining pioneer since 2004. As a Process Mining expert and Lean Six Sigma Black Belt, he has over ten years of practical, hands-on experience with applying process mining to improve customers’ processes. At Fluxicon, he is sharing his vast experience to make sure you succeed.