
This is the 5th article in our series on typical process mining data preparation tasks. You can find an overview of all articles in the series here.
In a process mining analysis, the variants can be an interesting metric to distinguish the common and exceptional behavior. However, to analyze the variants in a meaningful way we need to have the data set on the right level of abstraction (see also these strategies to simplify complex process maps).
In a previous article about unfolding activities we have shown how to unfold each iteration of a repeating activity. Adding this additional detail was helpful to answer questions about the number of times these repetitions occurred and to analyze them in more detail.
But there can also be situations, where we want to get rid of repetitions altogether.
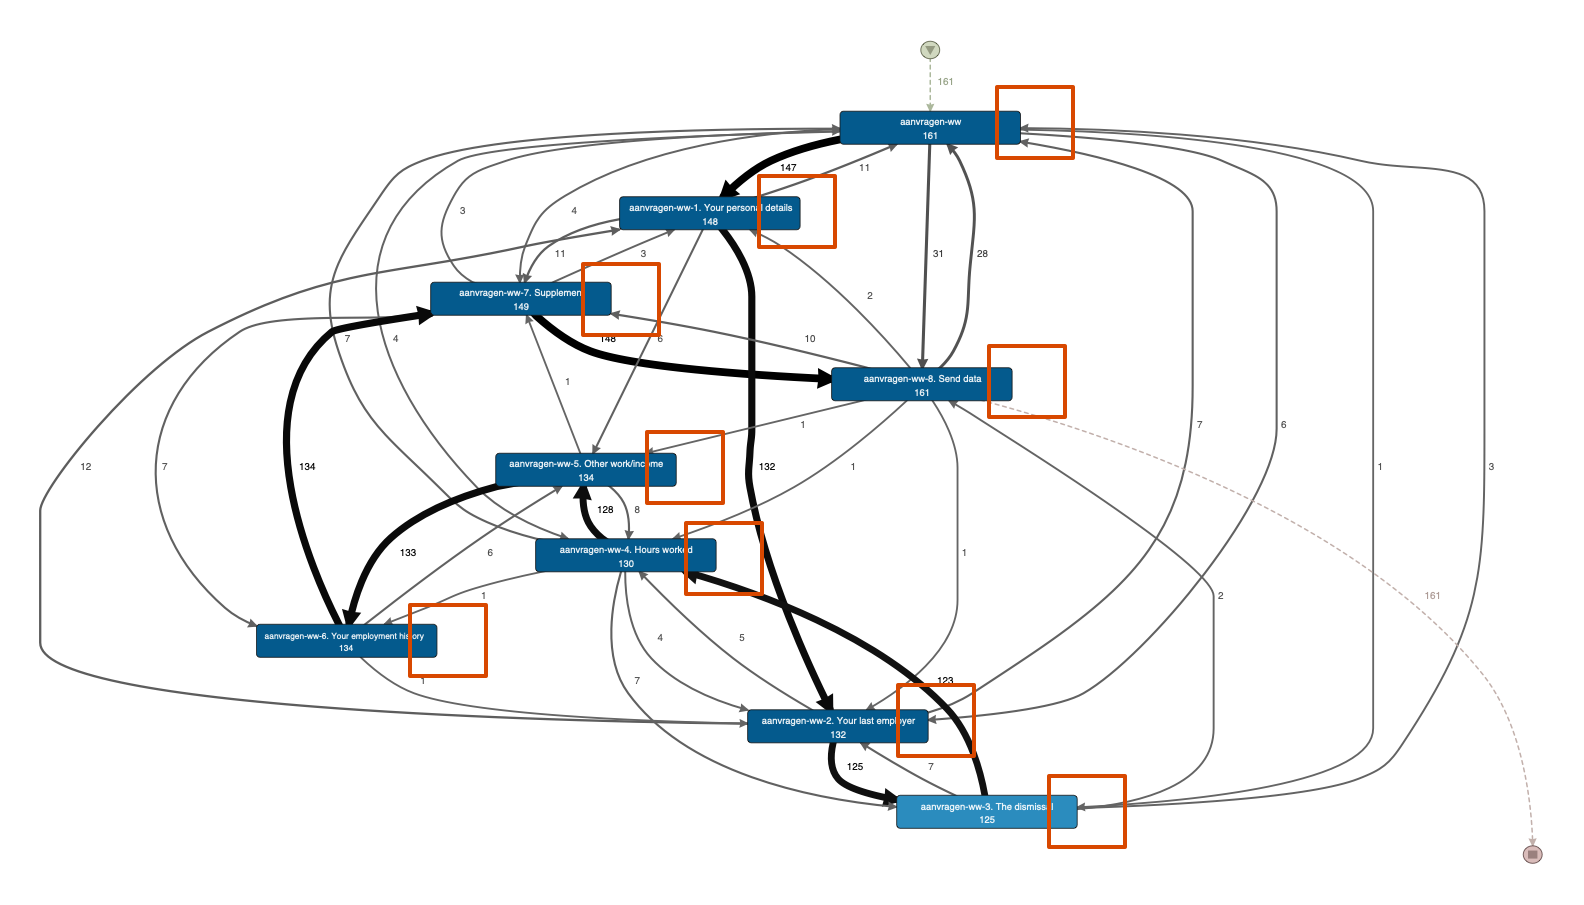
Take a look at the following example snippet from the 2016 BPI Challenge. The data set consists of the steps that people follow to apply for unemployment benefits. Each step is a click on the website of the unemployment benefit agency (click on the image to see a larger version).

What you can see in this process map is that there are a lot of self loops (highlighted by the red rectangles in the image above). These repetitions come from multiple clicks on the same web page. They can also come from a refresh, an automated redirection, or an internal post back to the same page. So, they are more of a technical nature than an actual repetition of the same process step.
As a result, these repetitions are not meaningful for analyzing the actual customer experience for this process. What is worse, these repetitions also create many more variants than there actually are from a high level process perspective.
For example, when you look at the process map above, they you can see that there is a dominant path through the process (indicated by the thick arrows). However, when we look at the individual cases (see screenshot below), then there are 158 different variants for just 161 cases.
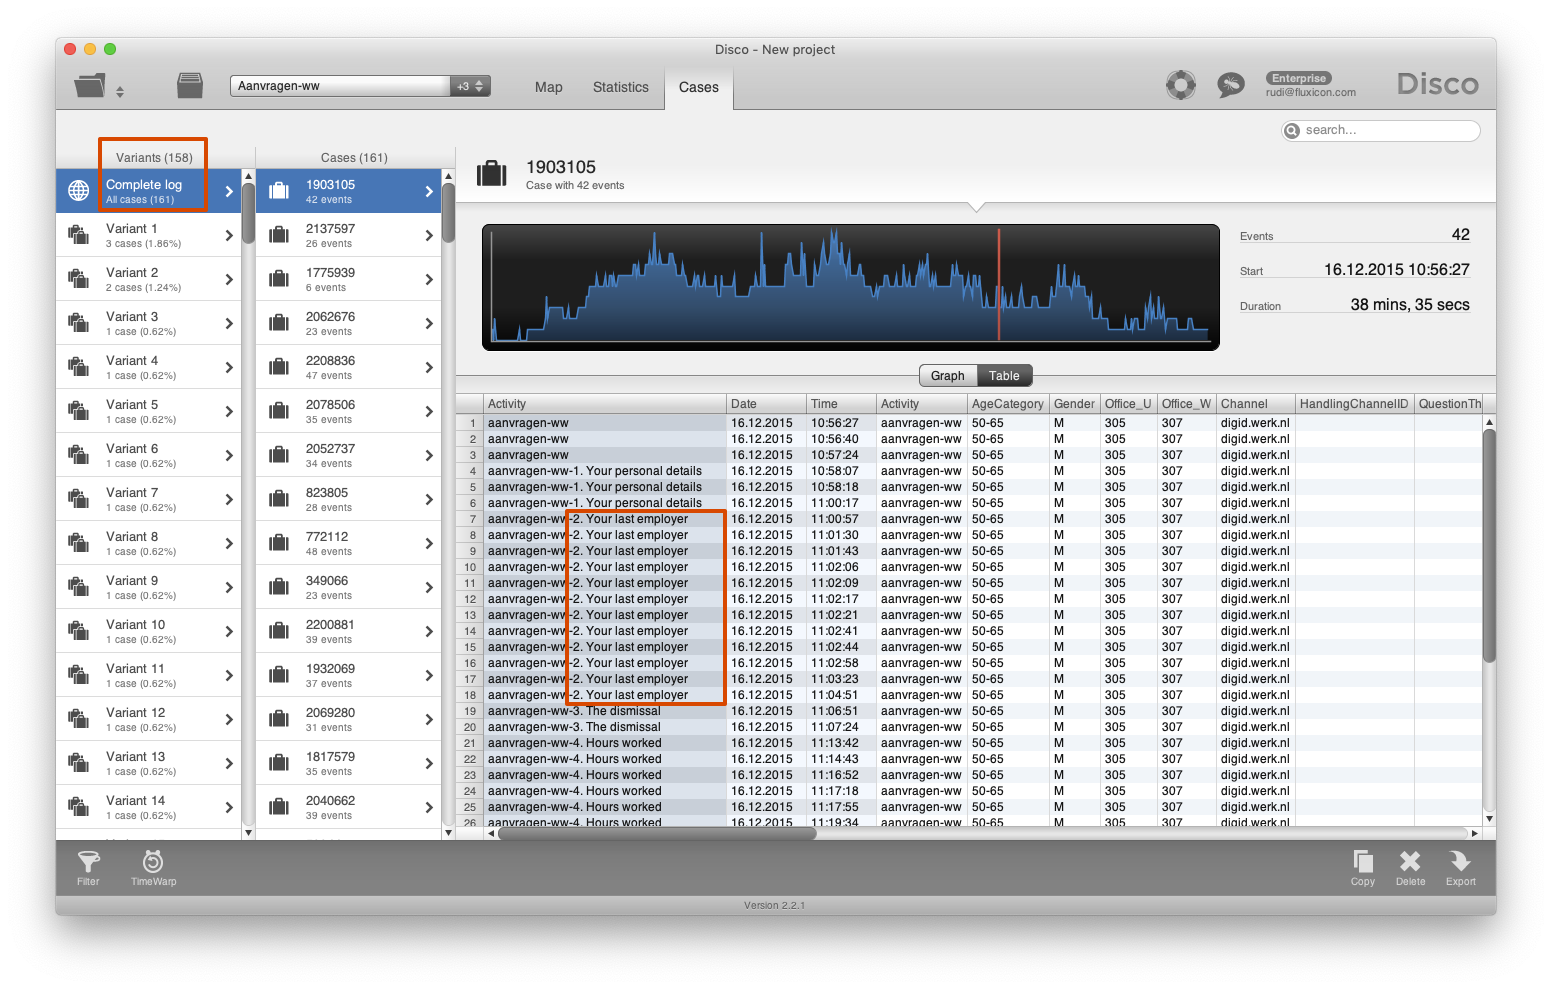
Only variant 1 and 2 have cases in common and we can quickly see why: The many repetitions create unique variants by the different numbers of iterations. For example, the currently selected case 1903105 has 12 repetitions of the process step ‘Your last employer’. These stem from the number of clicks that the user has taken to fill out the form on this page. If another applicant had clicked one time more or less on this page, then these two would immediately fall into two separate variants.
However, there is a way to extend your data in such a way that you can analyze more meaningful variants. In this article we will show you how.
What we want to do is to be able to focus on the steps in the process that are different. For example, when you right-click on the case history table of case 1903105 shown above, you can save this individual case history via the ‘Export as CSV…’ option. When we do this for another case 2137597 and open both of them in Excel, we can highlight the steps that we actually would like to compare (see below).
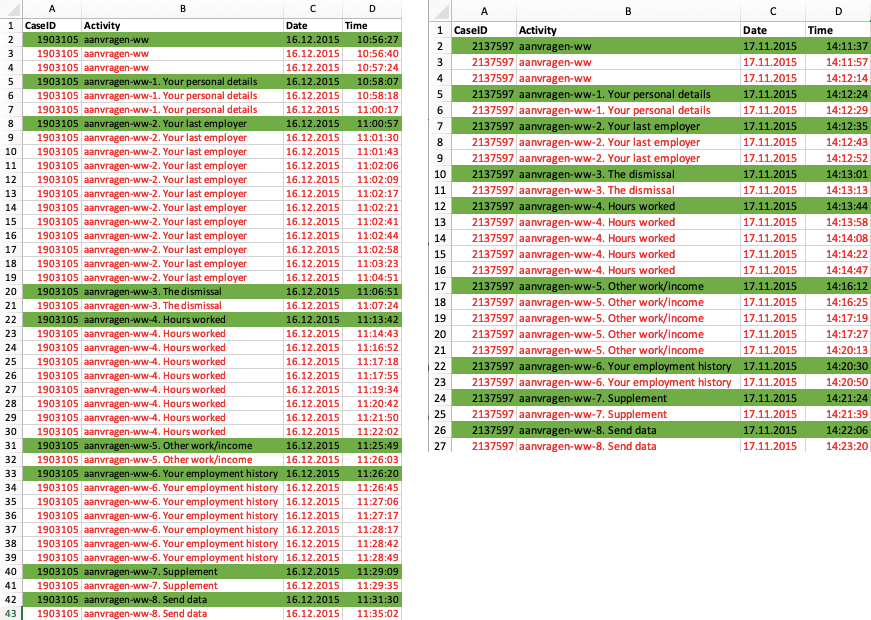
As you can see, both the cases 1903105 and 2137597 are following a different variant pattern if you look at the data on a detailed level. However, you can argue whether on not they are actually different from a customer experience point of view. When we highlight only the first occurrence of the reoccurring events (marked in green), you can see that both cases are actually following the same sequence through the process.
The repetitions introduce a lot of variation that is not relevant from a high-level view of this process. So, what we would like to do is to be able to exclude these repetitions from our analysis. We will do this in a non-invasive manner by adding an extra column that indicates whether an event is a repetition or not in the following way.
Step 1: Export your data with the right perspective
For most processes, you can take multiple perspectives depending on how you configure your case ID, your activity name, and your timestamp during the import step. Since the interpretation of what repeating activities are depends on your current perspective, you can best simply export your data from Disco as a CSV file.
You will see that the exported CSV file includes the CaseID, Activity and Timestamp columns in the way in which you have configured them previously during your data import (when multiple columns are selected as the CaseID or Activity they are already concatenated).
Step 2: Transform your data
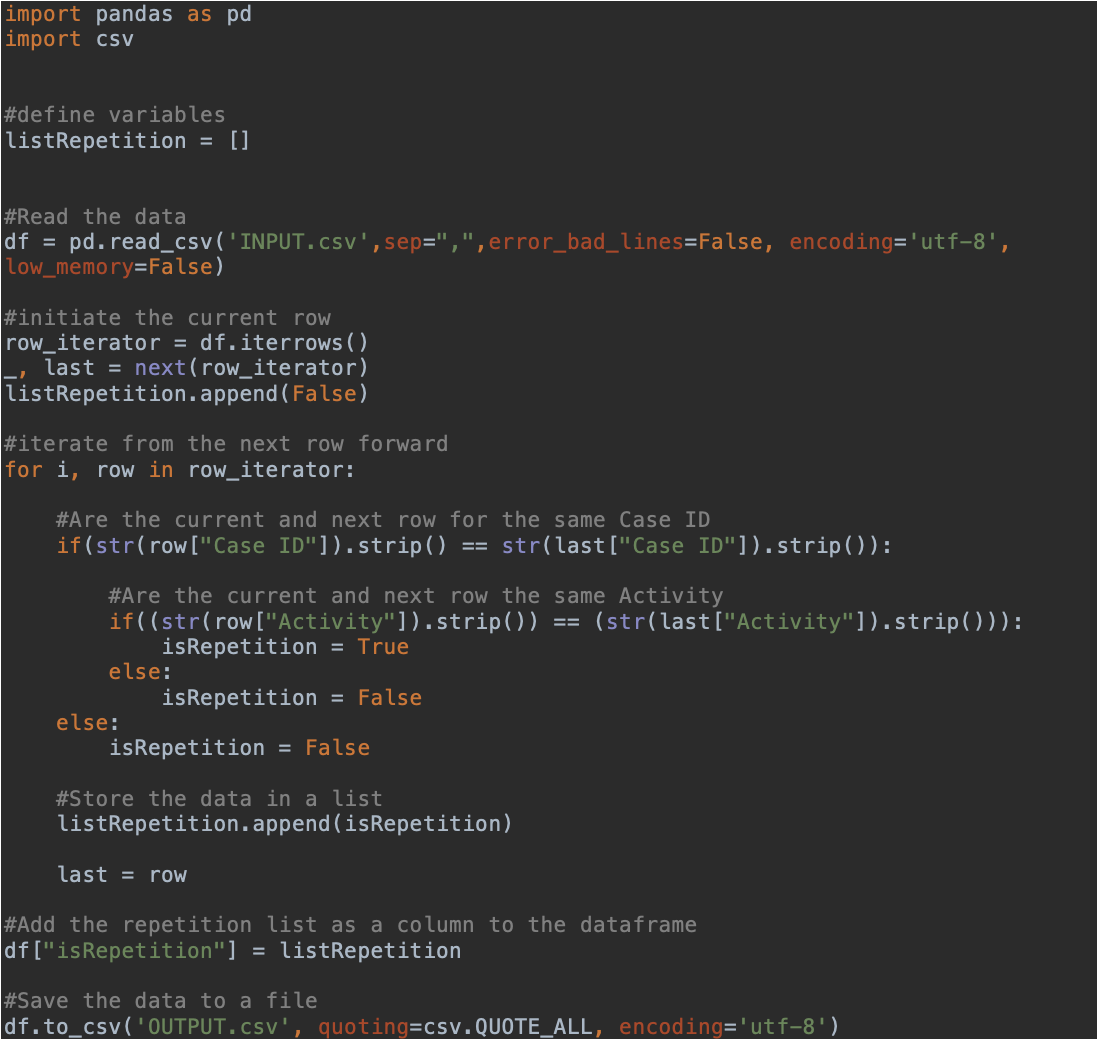
To identify reoccurring events, I have used the following Python script (see code below or download the script here). This script goes through every event for every case. It evaluates if the proceeding event was the same and adds a isRepetion column with TRUE (when the proceeding activity is the same) or FALSE (in all other cases). The Pandas library (https://pandas.pydata.org) has been used to iterate trough all the events. However, you can take the same approach in any programming or query language of your preference.
Update: To learn how you can transform your data in Excel rather than using Python, refer to our follow-up article on Removing Repetitions with Excel here.
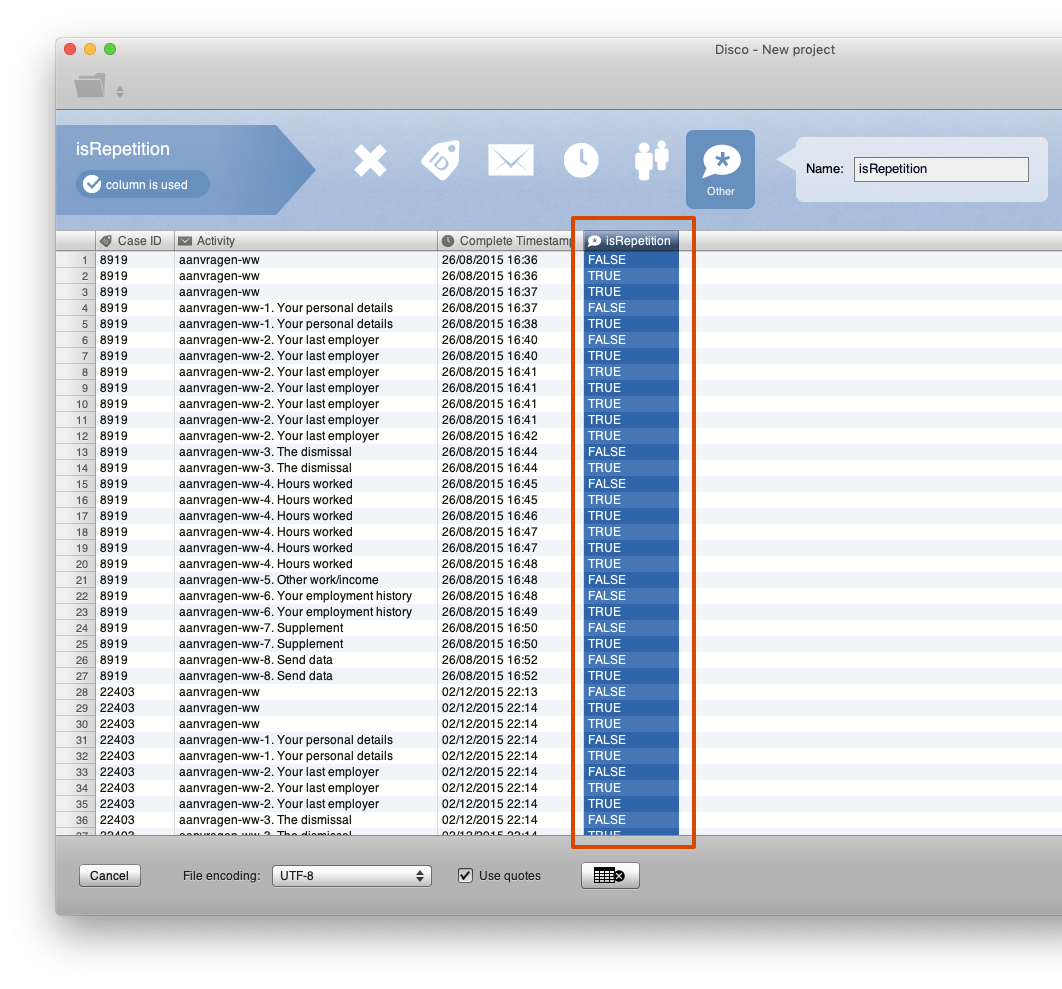
The result is a CSV file that includes the new isRepetition column. When importing this new CSV file into Disco you can mark this column as an Other attribute, so that it can be used for filtering in the next step (see screenshot below).
After importing this new data set, the process map still looks exactly the same as the map we saw at the very beginning (with a lot of self-loops due to the many repetitions).
Step 3: Filter the repeating activities
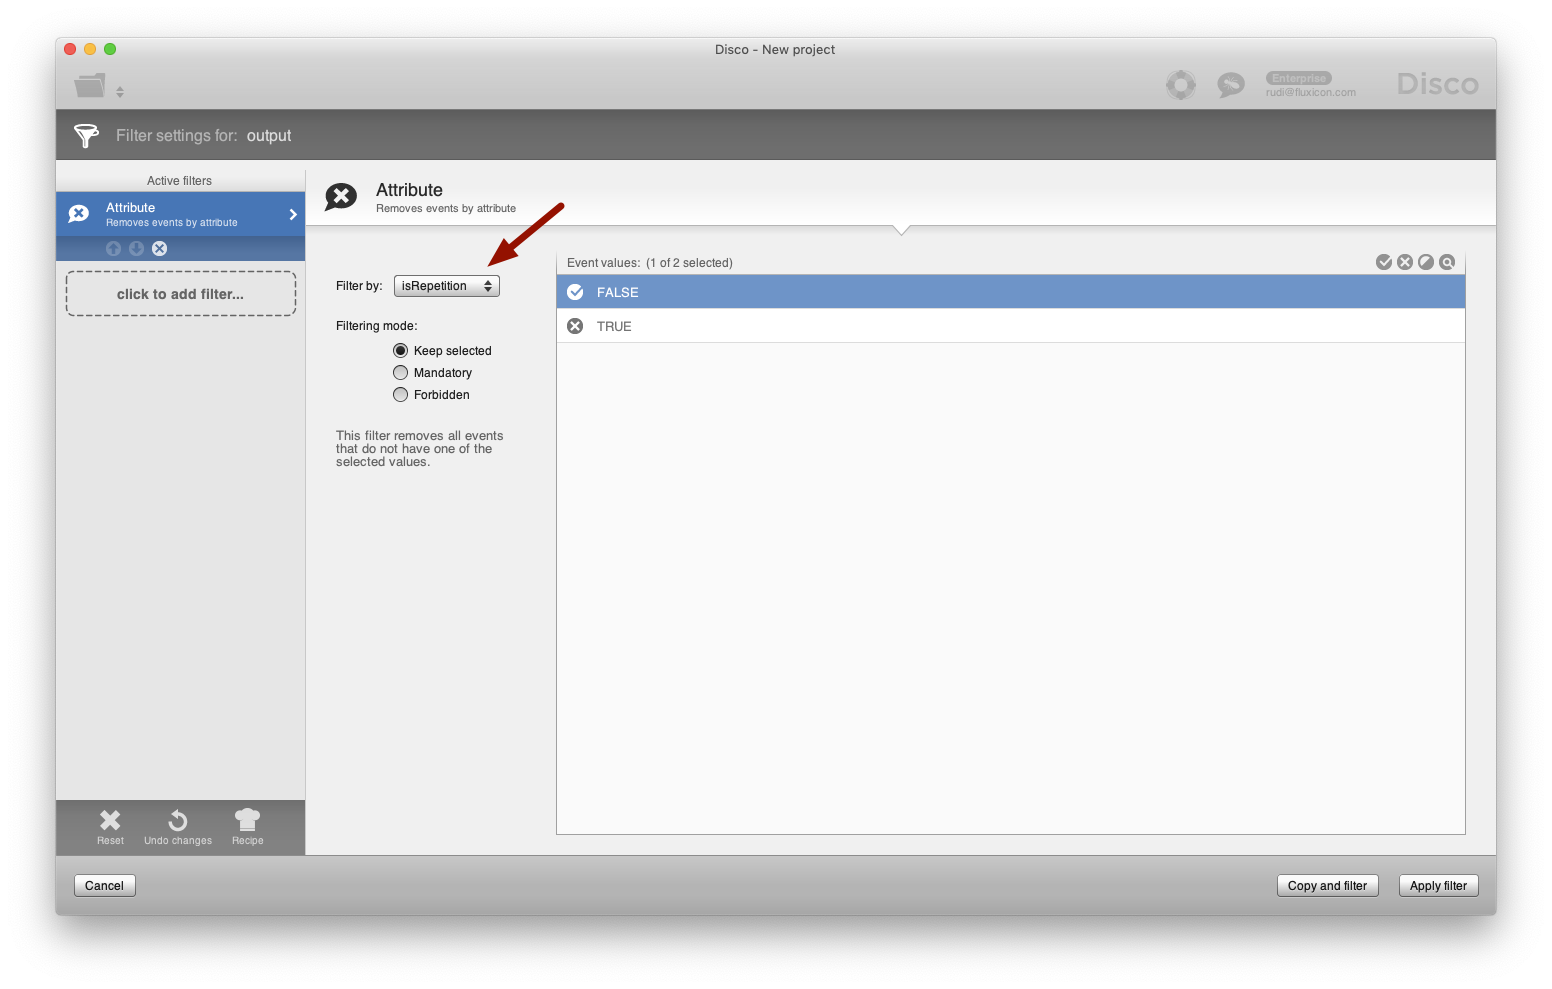
However, now we can easily exclude the repeating events from our analysis by applying an Attribute Filter (see screenshot below). This will keep only the first occurrence of a sequence of reoccurring activities, which are exactly the green events in the Excel comparison above.
When pulling up both the activity and path sliders in the process map, we can now see that all the self-loops have disappeared (see below).
Furthermore, when we inspect the variants in the Cases tab, then we can see that the variation in the data set has been reduced (see screenshot below). The 161 cases now follow 65 different variants and Variant 1 has become a dominant variant that covers 44.1 % of all the cases.

The dominant variant is now describing the expected behavior. With the simplified data set the variants are on the right level to analyze what happens to the cases that deviate from this expected process pattern.
Step 4: Analyzing the process
With the filtered data set we can now also analyze the rework in the process without being disturbed by the repetitions that were observed on the same page. Here are two examples:
Question 1: How often were applicants returning to the initial process step?
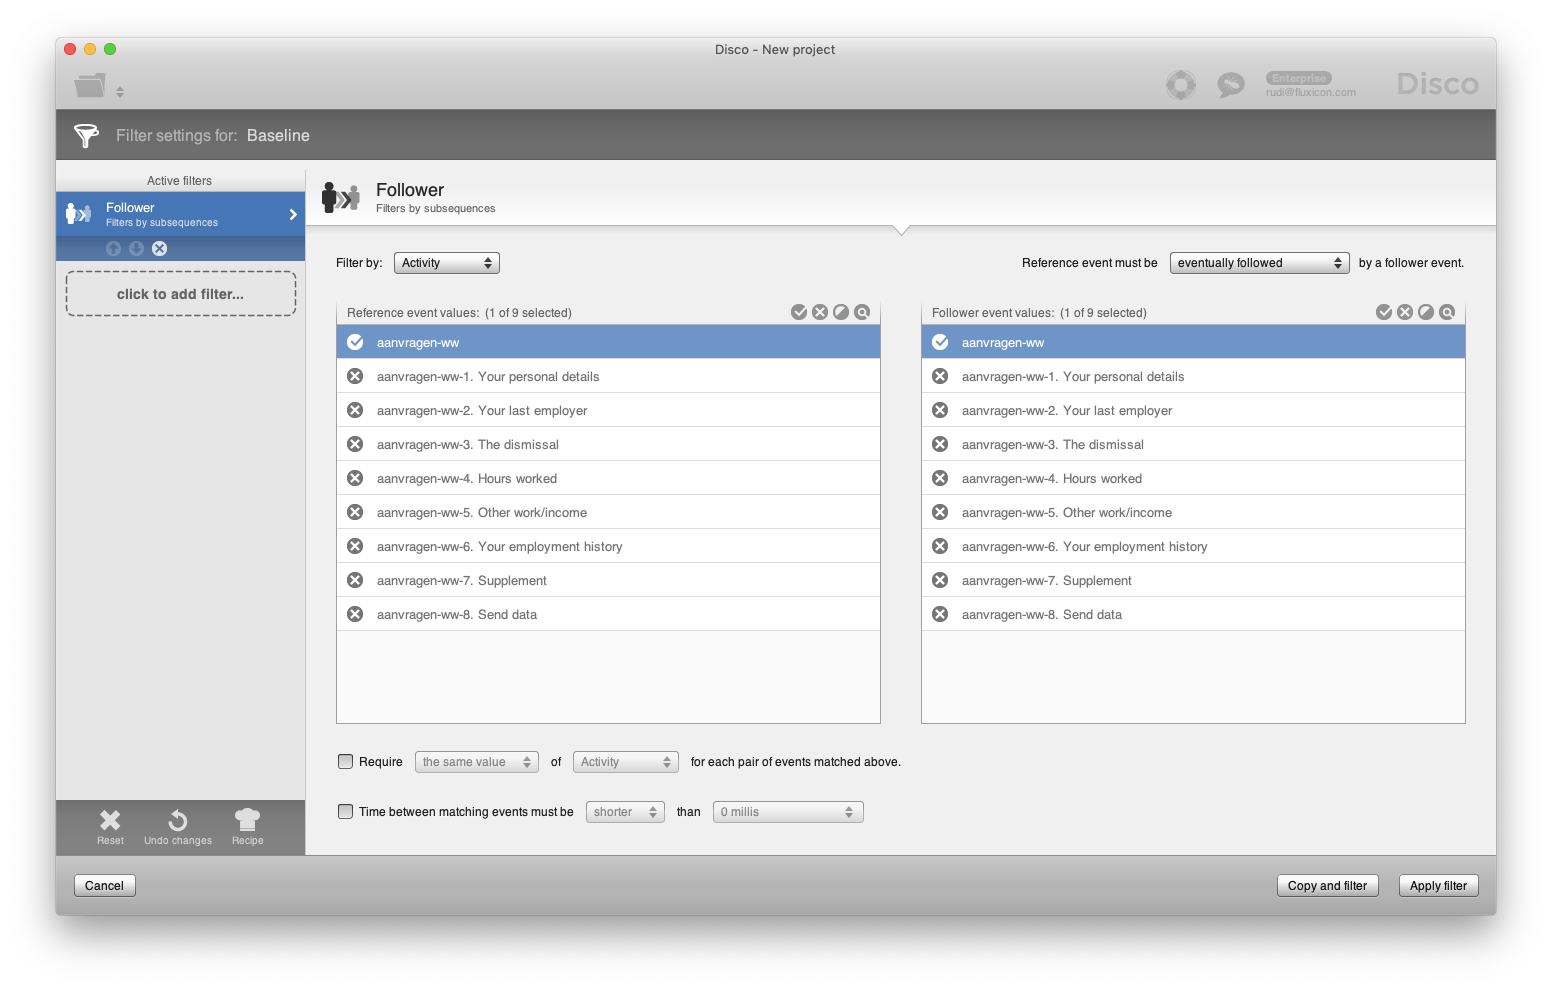
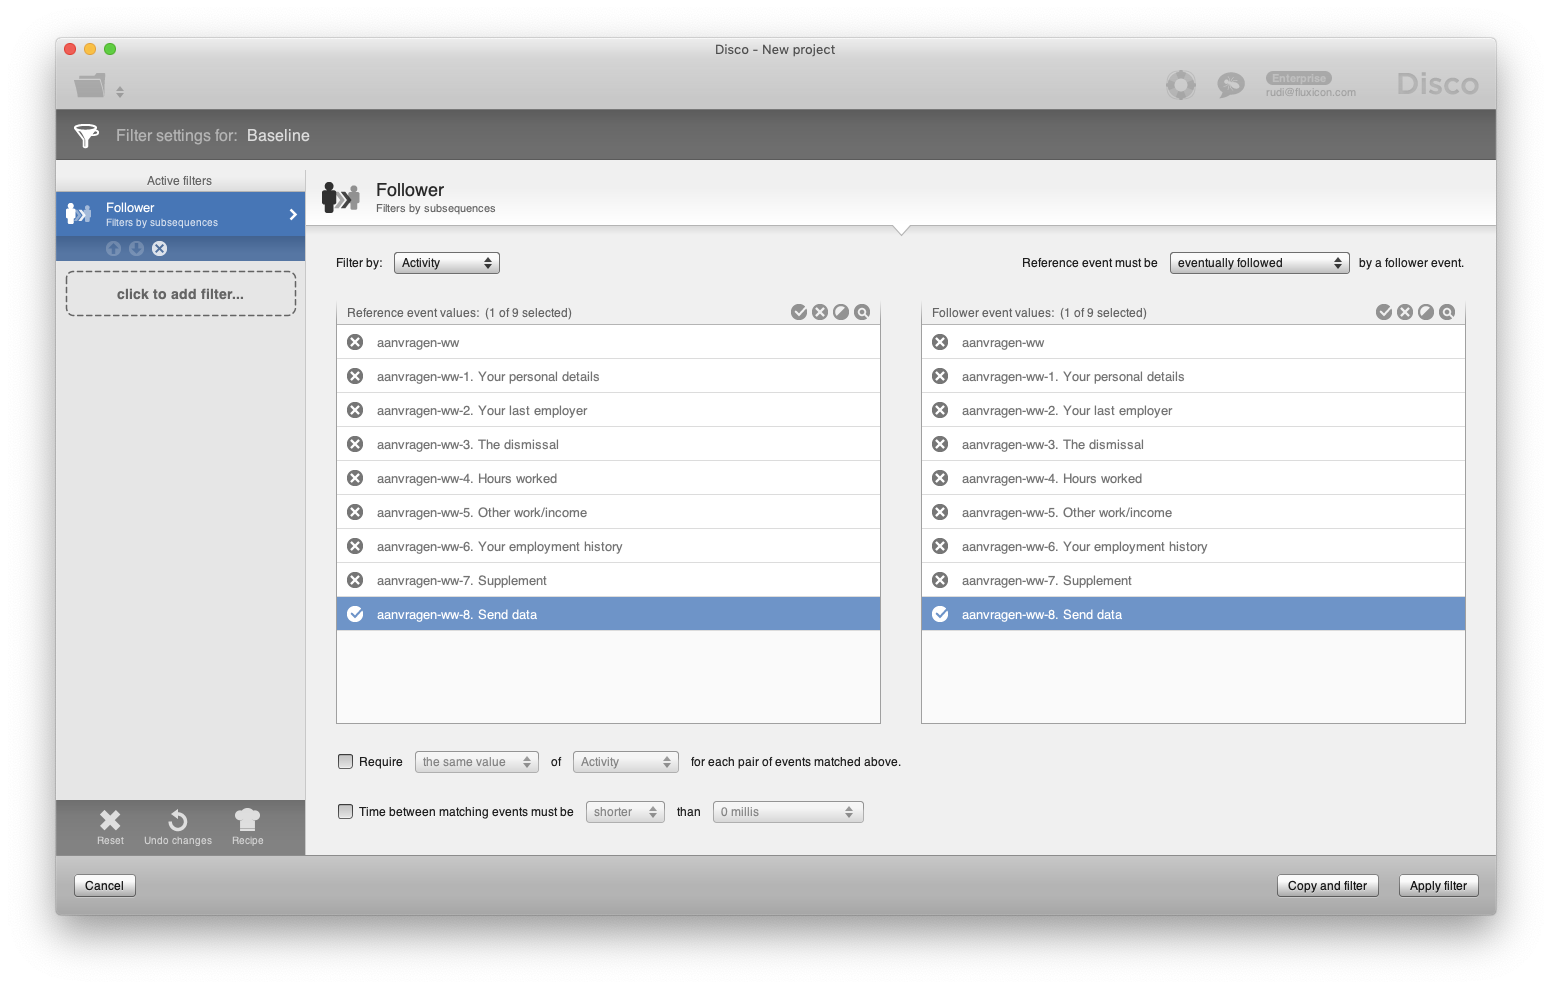
If applicants return to the beginning of the process then this could mean that they postpone their application to take time to find the required information. They either don’t understand what is being asked or they don’t have the time to complete the application at once. Filtering these cases can be done using a Follower filter in Disco as shown in the screenshot below.
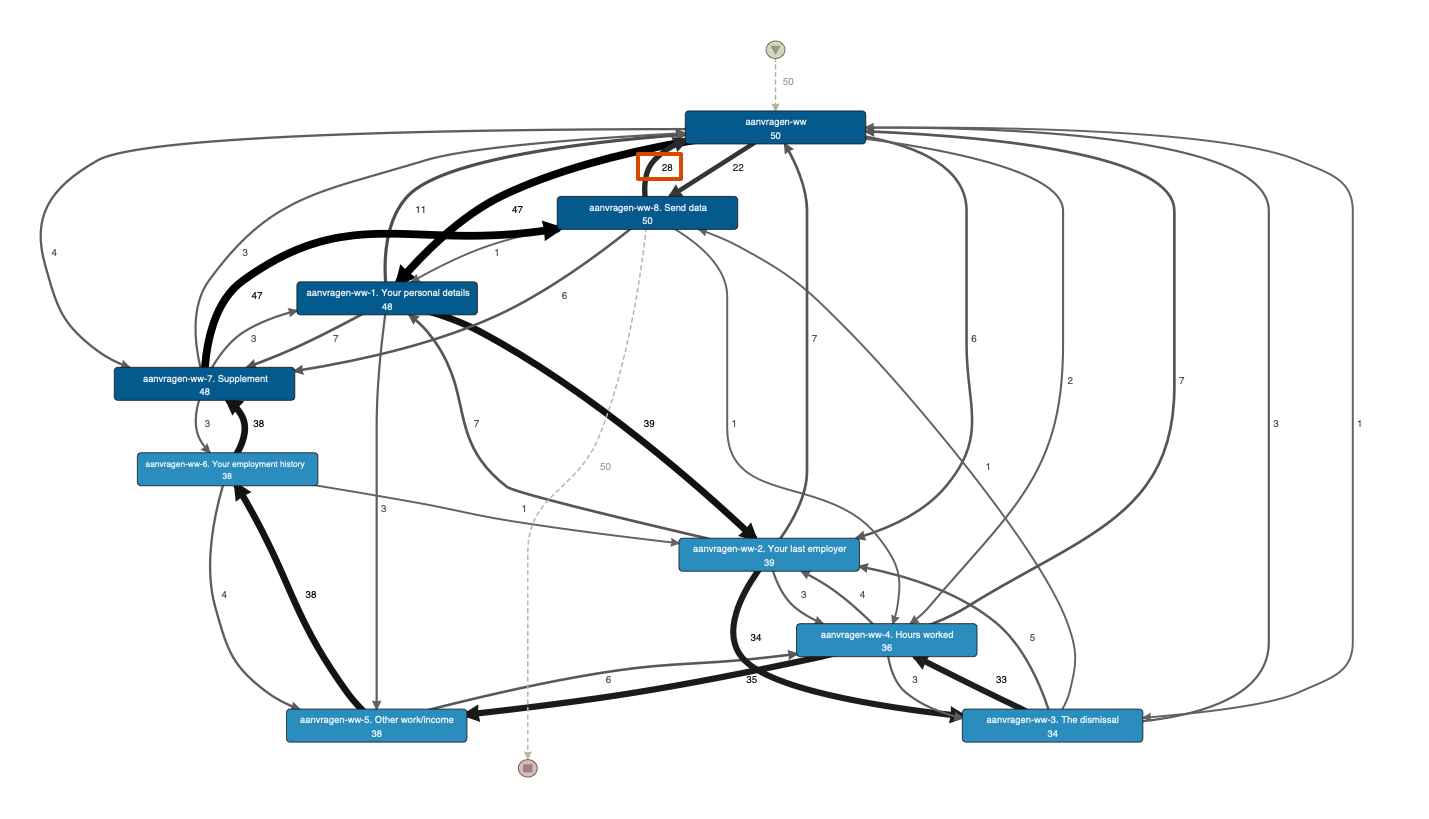
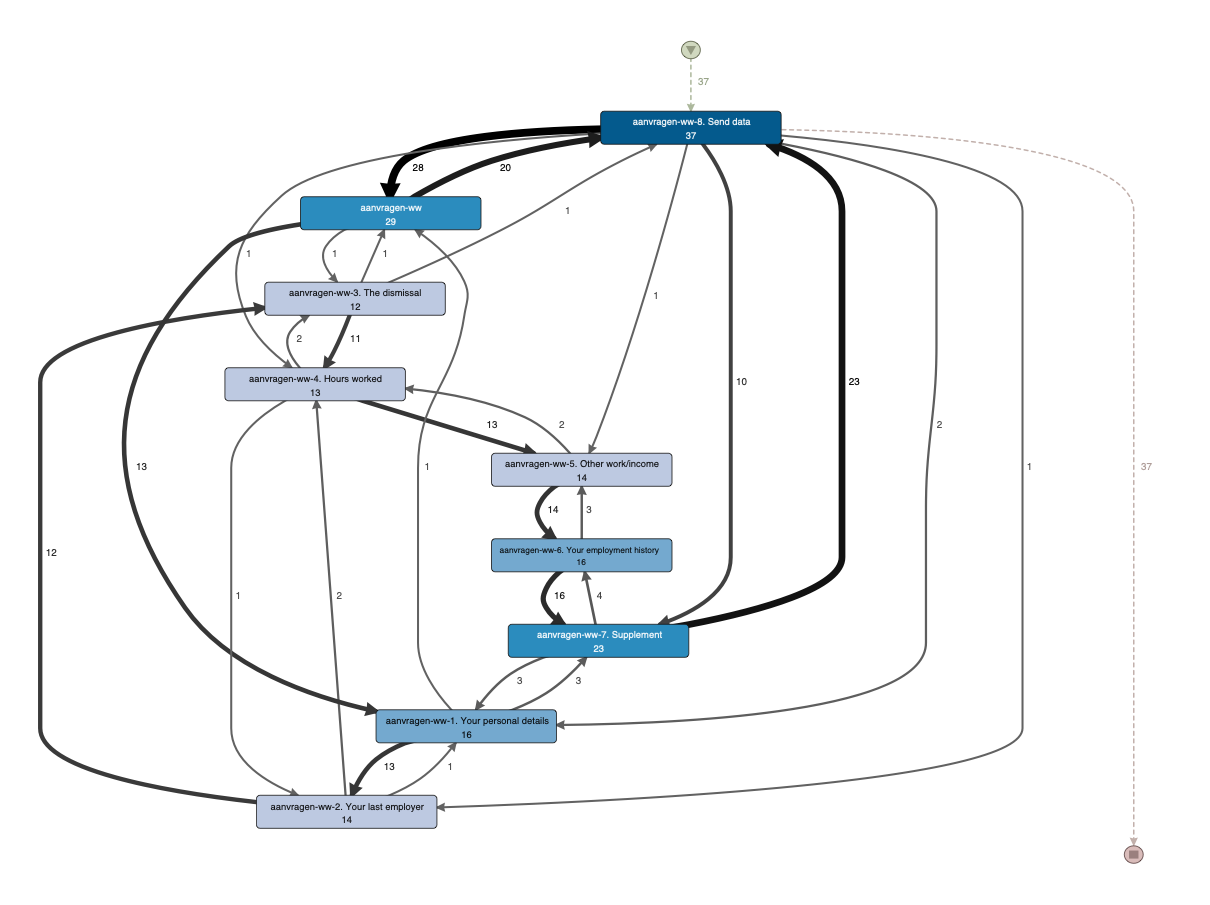
55% of the cases that don’t follow the dominant variant include this pattern. In the process map below you can see that for the 50 cases that return to the beginning of the process, 28 cases (more than half) go back after the ‘Send data’ step, potentially leading into a resubmission of the application.
Question 2: What happens when resubmitting the application?
To analyze in more detail what happens when the application is resubmitted, we first need to filter all the applications where the ‘Send data’ step occurred again (see screenshot below).
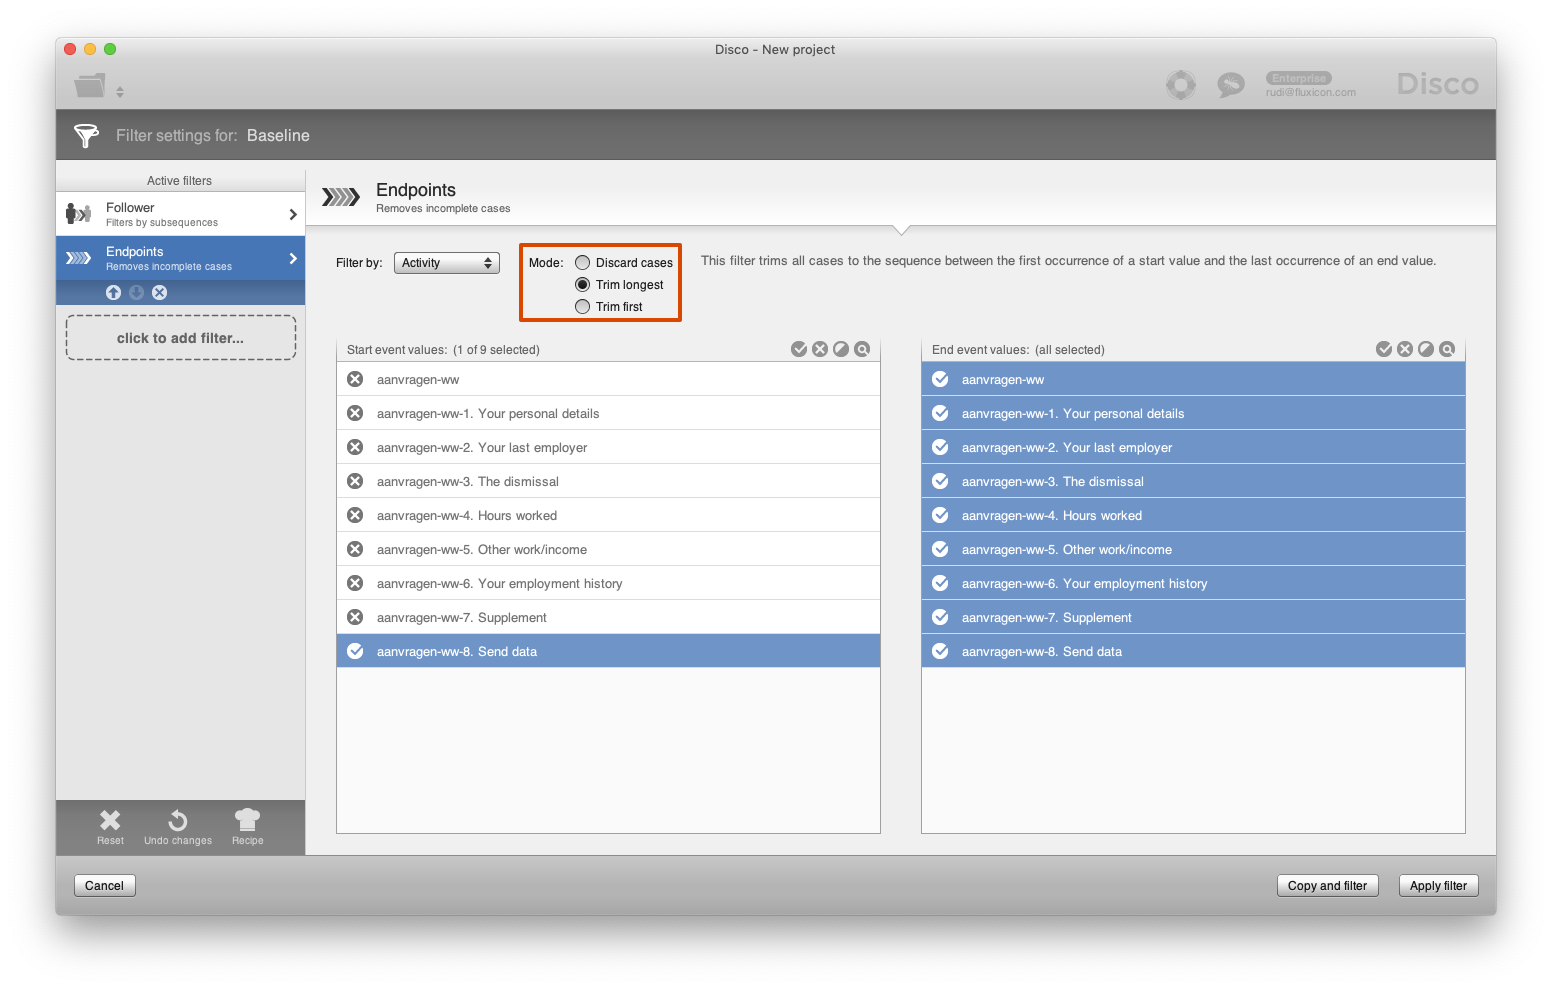
To focus on the actual re-submission part, we want to analyze what happens after the first occurrence of the ‘Send data’ step. For this, we can add an Endpoints filter with the ‘Trim longest’ option to remove all the steps after the first occurrence of ‘Send data’ (see below).
Now, we can analyze which pages were revisited after submitting the request the first time (see below).
The advantage of the approach described in this article - adding an attribute to filter out repetitions rather than removing the repeating events from the data set altogether - is that you preserve your original data and can always go back to analyze the process on a more fine-grained level as well later on. For example, perhaps there are some of the process steps for which you want to analyze the detailed click sequences on the page in a second step.
Finally, two things need to be kept in mind when you remove repetitions from your data set:
- If you are analyzing your process from multiple perspectives (see Step 1 above) then you need to apply the transformation steps described in this article for each of these perspectives.
- If you remove activities to simplify your process with the Milestone simplification strategy (or have applied some other filter that removes events) after you have added the repetition attribute, then this can create new repetitions that were not there before. To remove these new repetitions as well, you need to go back to Step 1 and repeat the process.

Rudi Niks
Process Mining and everything else
Rudi has been a process mining pioneer since 2004. As a Process Mining expert and Lean Six Sigma Black Belt, he has over ten years of practical, hands-on experience with applying process mining to improve customers’ processes. At Fluxicon, he is sharing his vast experience to make sure you succeed.