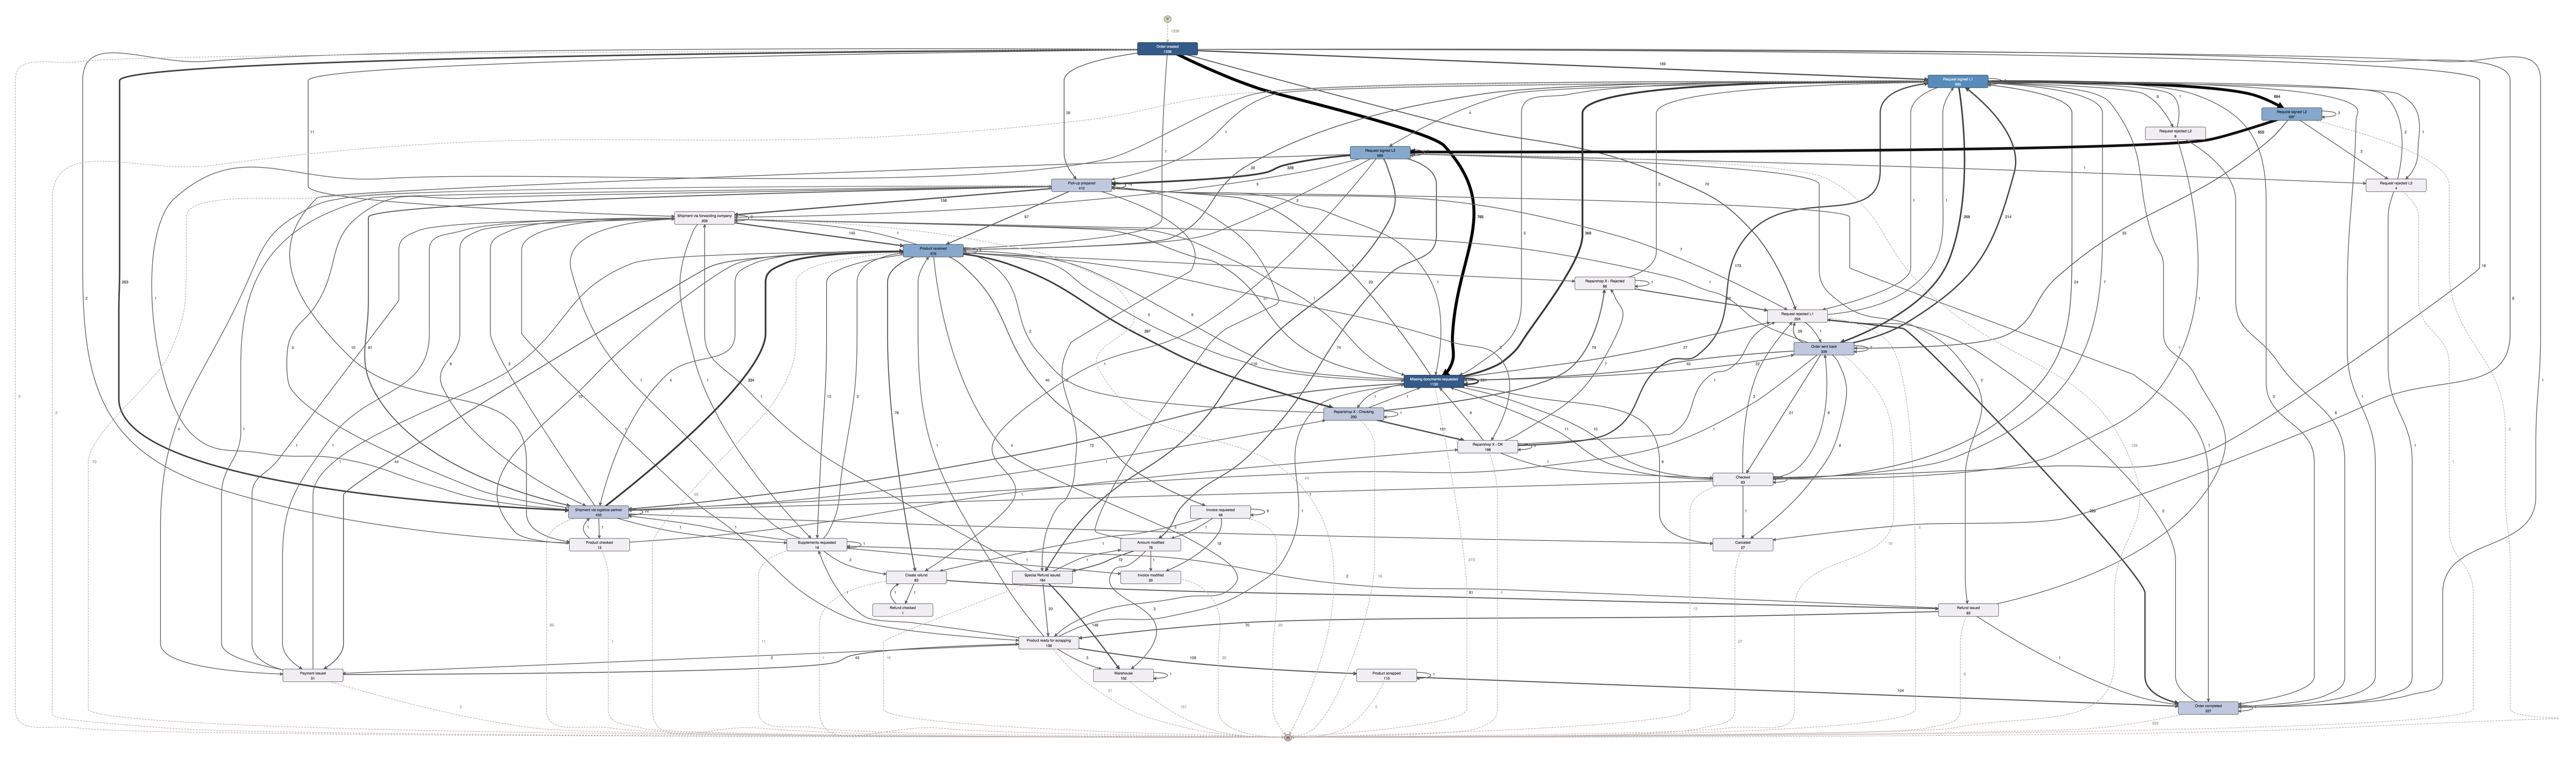
Have you ever imported a data set in your process mining tool and what you got was a complex spaghetti process? Often, real-life processes are so complex that the resulting process maps are too complicated to interpret and use.
For example, the process that you get might look like the picture above.
The problem with this picture is not that it is wrong, in fact this is the true process if you look at it in its entirety. The problem is that this process map is not useful, because it is too complicated to derive any useful insights or actionable information from it.
What we need to do is to break this up and to simplify the process map to get more manageable pieces.
In this series1, you will learn 9 simplification strategies for complex process maps that will help you get the analysis results that you need. We show you how you can apply these strategies in the process mining software Disco (download the free demo version from the Disco website to follow along with the instructions).
The 9 strategies are grouped into the following four parts. You can find the first two strategies in today’s article below. The remaining parts will be released in the next days and linked from here.
Part I: Quick Simplification Methods (this article)
Part II: Remove Incomplete Cases
Part III: Divide and Conquer
Part IV: Leaving Out Details
Let’s get started!
Part I: Quick Simplification Methods
First, we look at two simplification methods that you can use to quickly get to a simpler process map.
Strategy 1) Interactive Simplification Sliders
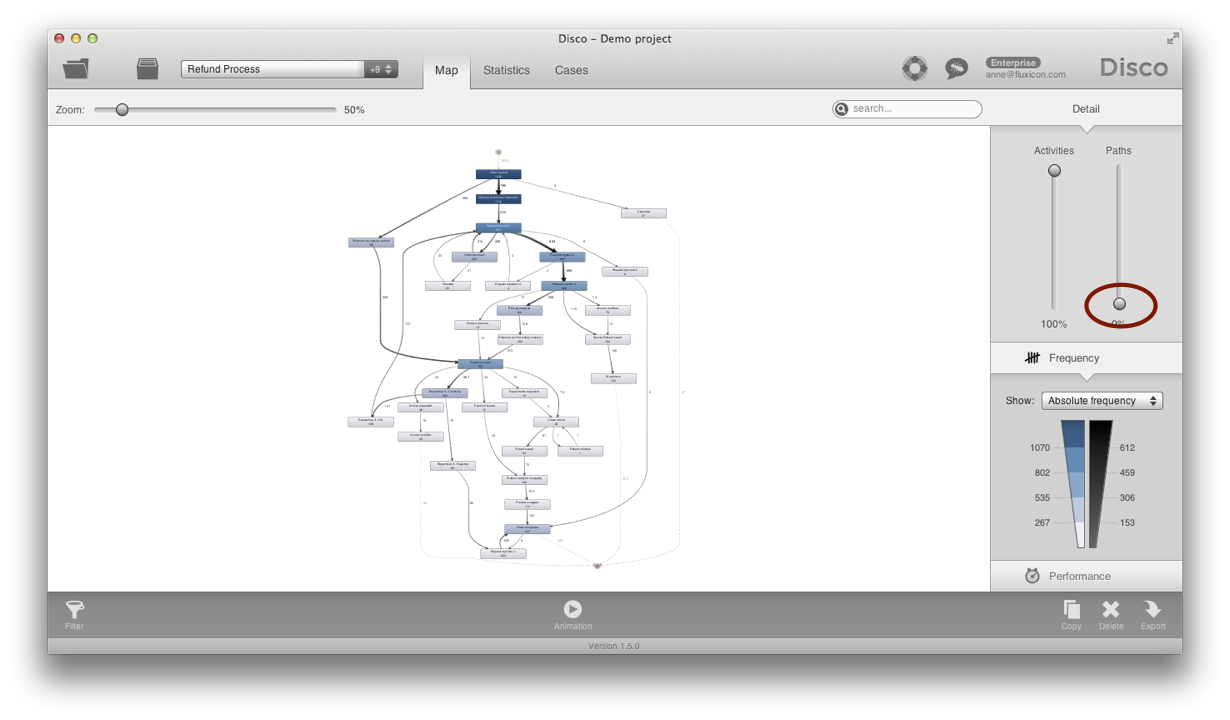
The first one is to use the interactive simplification sliders that are built in the map view in Disco (see below).

The Disco miner is based on Christians Fuzzy Miner2, which was the first mining algorithm to introduce the map metaphor, including advanced features like seamless process simplification and highlighting of frequent activities and paths. However, the Disco miner has been further developed in many ways.
One important difference is that if you pull both the Activities and the Paths sliders up to 100% then you see an exact representation of the process. The complete picture of the process is shown, exactly as it happened. This is very important as a reference point and one-on-one match of your data to understand the process map.
However, without applying any of the simplification strategies discussed later, the complete process is often too complex to look at on 100% detail.
Here is where the interactive simplification sliders can give you a quick overview about the process. We recommend to start by pulling down the Paths slider, which gradually reduces the arcs in the process map by hiding less frequent transitions between activities.
At the lowest point, you only see the most important process flows, and you can see that the spaghetti process map from above has been simplified greatly, already yielding a very readable and understandable process map (see below).
What you will notice is that some of the paths that are shown can be still quite low-frequent. For example, in the following fragment you see that there are two paths with just the frequency 2 (see below). The reason is that the Paths simplification slider is smart enough to take the process context into account and sees that these paths connect the very low-frequent activity Request rejected L3, which just occurred 4 times (see below). It would not be very useful to have low-frequent activities flying around, disconnected from the rest of the process.
The Paths slider is very important, because it allows you to see everything that has happened in you process (all the activities that were performed), but still get a readable process map with the main flows between them.

Often, you will find that getting a quick process map with all the activities shown (Activities slider up at 100%) and only the main process flows (Paths slider down at lowest point, or slightly up, depending on the complexity of the process) will give you the best results.
However, if you have many activities, or if you want to further simplify the process map, you can also reduce the number of activities by pulling down the Activities slider (see below).
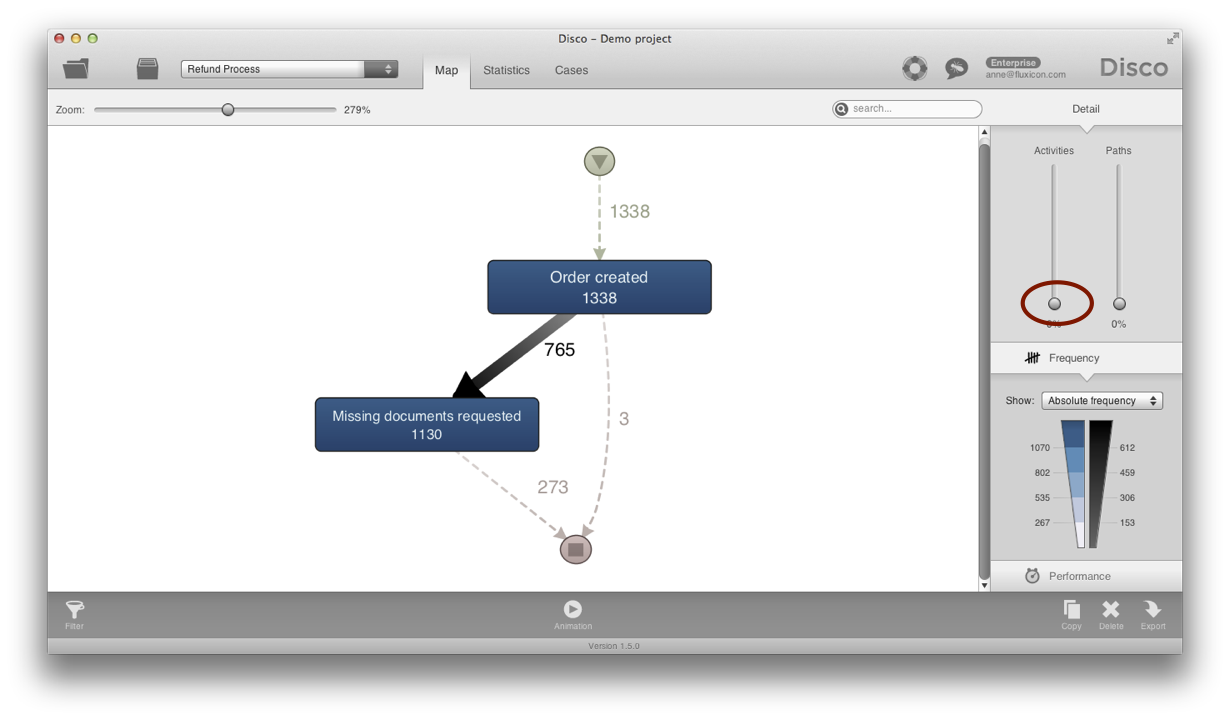
At the lowest point, the Activities slider shows you only the activities from the most frequent process variant (see also strategy No. 2 in the next section). This means that only the activities that were performed on the most frequent path from the very beginning to the very end of the process are shown. So, this shows you really the main flow of the process (now also abstracting from less frequent activities, not only less frequent paths).
For example, the spaghetti process map from the beginning could be greatly simplified to just the main activities Order created and Missing documents requested by pulling down the Activities slider (see below).
Strategy 2) Focusing on the Main Variants
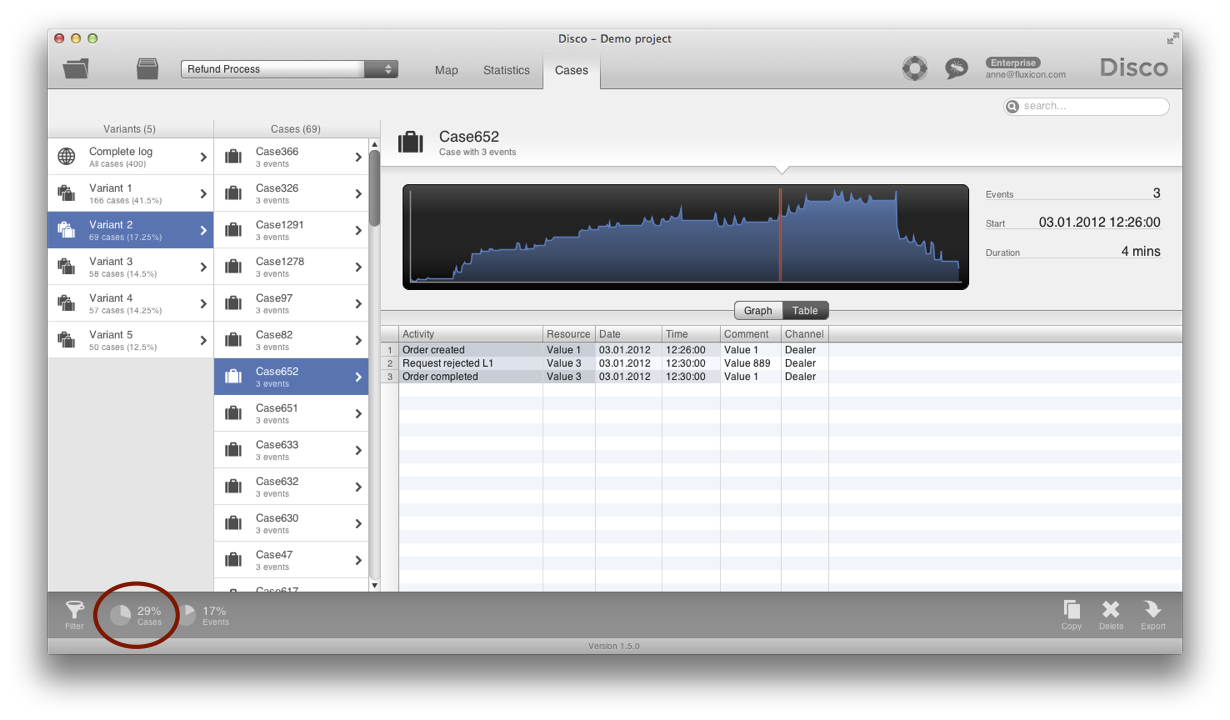
An alternative method to quickly get a simplified process map is to focus on the main variants of the process. You find the variants in the Cases view in Disco.
For example, one case from the most frequent variant (Variant 1) is shown in the screenshot below: There are just two activities in the process, first Order created and then Missing documents requested (so, most cases are actually, strangely, waiting for feedback from the customer, but we are not focusing on this at the moment).
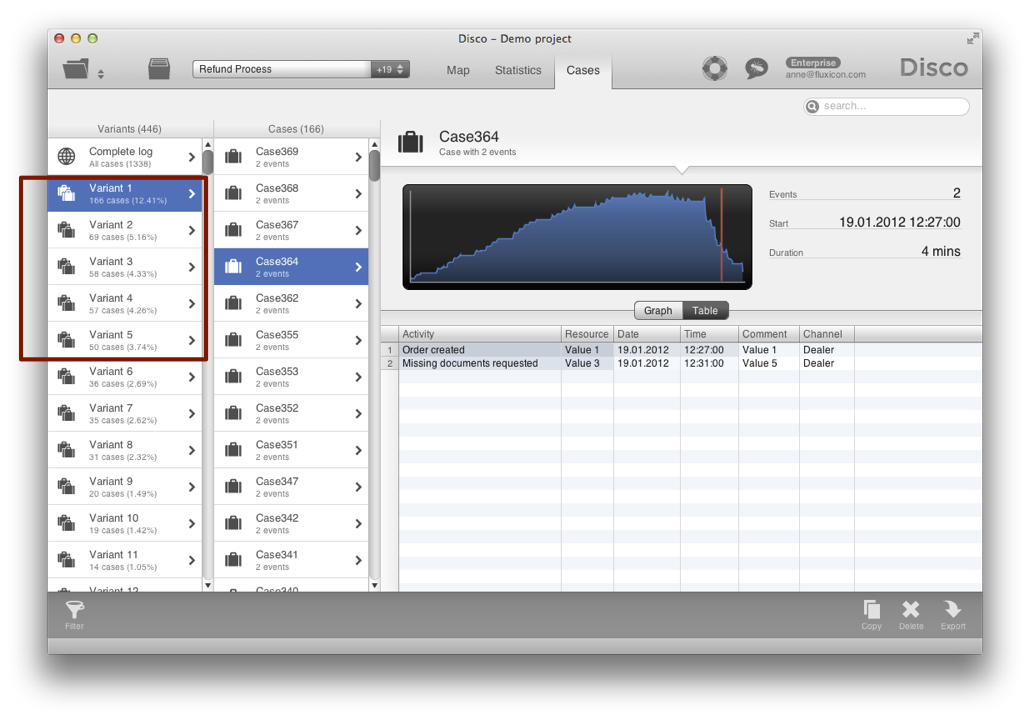
If you look at the case frequencies and the percentages for the variants, then you can see that the most frequent variant covers 12.41%, the second most frequent covers 5.16% of the process, etc. What you will find in more structured processes is that often the Top 5 or Top 10 variants may already be covering 70-80% of your process. So, the idea is to directly leverage the variants to simplify the process.
Note: This strategy only works for structured processes. In unstructured processes (for example, for patient diagnosis and treatment processes in a hospital, or for clicks-streams on a website) you often do not have any dominant variants at all. Every case is unique.
In such unstructured processes, variant-based simplification is completely useless, but the interactive simplification sliders from the previous section still work (they always work).
You can easily focus on the main variants in Disco by using the Variation filter (see below). For example, here we focus on the Top 5 variants by only keeping the variants that have a support of 50 cases or more.

Only the Top 5 variants are kept and we see that these few (out of 446) variants are covering 29% of the cases.
If you now switch back from the Cases view to the Map view, you can see the process map just for those 5 variants (see below).
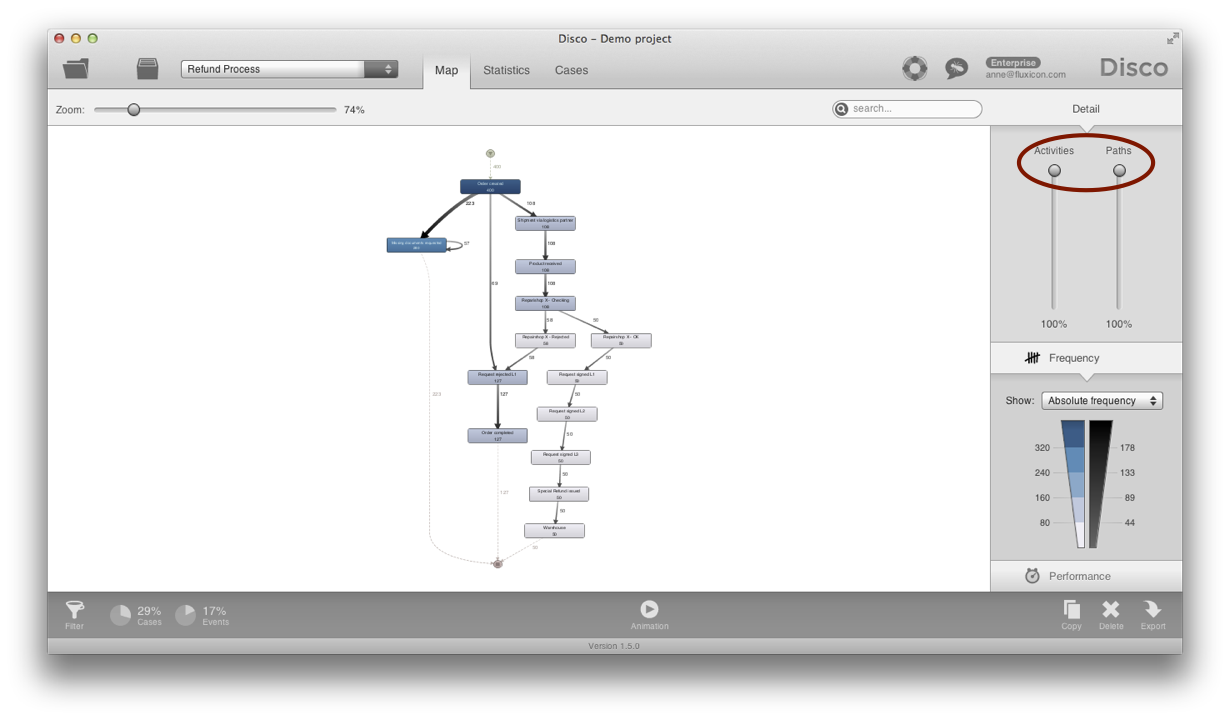
The trick here is that, this way, you can easily create a process map with 100% detail (notice both the Activities and paths sliders are pulled up completely) - But of course only for the variants that are kept by the filter.
This method can be particularly useful if you need to quickly export a process map for people who are not familiar with process mining. If you export the process map with 100% detail then all the numbers add up (no paths are hidden) and you do not need to explain what spaghetti processes are and why the process map needs to be simplified. You can simply send them the exported PDF of the process map and say, for example, This is how 80% of our process flows (depending how many % your variant selection covers).
Note, however, that less frequent activities are often hidden in the more exceptional variants, and you do not see them when you focus on the main variants. Use the interactive simplification sliders from the previous section to quickly get a simplified map with the complete overview of what happens in your process.
These were two quick simplification strategies. Watch out for Part II, where we explain how removing incomplete cases can help simplifying your process maps.
-
The article previously appeared in the Process Mining News - Sign up now to receive regular articles about the practical application of process mining. ↩︎
-
See Christian W. Gnther. Process Mining in Flexible Environments, PhD Thesis, Eindhoven, 2009. ↩︎

Anne Rozinat
Market, customers, and everything else
Anne knows how to mine a process like no other. She has conducted a large number of process mining projects with companies such as Philips Healthcare, Océ, ASML, Philips Consumer Lifestyle, and many others.