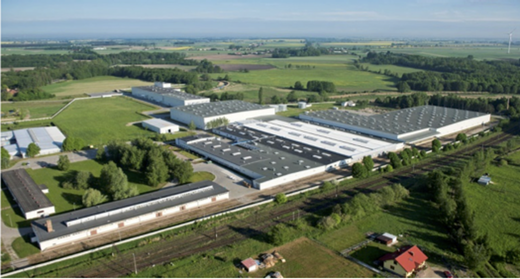
Photo 1: Dendro Poland Ltd.
This is a guest post by Zbigniew Paszkiewicz. Zbigniew describes a process mining project that he performed for Dendro, a mattress production company in Poland.
If you have a process mining case study that you would like to share as well, please contact us at anne@fluxicon.com.
Project Outline
Dendro Poland Ltd., located in the Wielkopolska region, near the city of Pozna in Poland, is a medium-size production company specializing in the production of mattresses that are exported to Western Europe. Dendro is an exclusive mattress supplier for IKEA shops in Western Europe with a mattress production volume of over 2 million per year. Since its origin, Dendro Poland Ltd. has been experimenting with innovative production technologies as well as management methods to boost operational efficiency and meet the rigid quality requirements of its clients.
The process mining project was initiated by Zbigniew Paszkiewicz, Research Assistant at the Pozna University of Economics, and conducted jointly with a Dendro Poland team led by the Distribution and Warehouse Manager Justyna Tarczewska. The aim of the project was to provide insights into the warehouse processes of the company.
The operation of Dendros warehouse is supported by a Warehouse Management System (WMS). The WMS is used by both storekeepers and management staff. Storekeepers feed the system with data associated with their activities, such as, for example, taking delivery, organizing shipment, transporting materials to production and receiving mattresses from the inventory. The management staff monitors stock levels and supervises the storekeepers’ work.
The process mining project was launched based on two strong premises:
-
Process mining could provide valuable insight into emerging managerial issues regarding the warehouse operations;
-
The WMS already stored big amounts of data ready to be mined.
The project was divided into two phases:
Phase 1: Mining the data that was already available in the WMS (associated with the Product Management and Material Management processes);
Phase 2: Modification of the WMS to log additional, high quality data for refined process mining. The scope of data collected for the Product Management and Material Management processes was expanded. Furthermore, additional data about two other processes, Material Receiving and Product Shipping, was transformed and prepared to be effectively mined on demand of the warehouse manager.
Due to the limited space, only some aspects of the Product Management process analysis in the first phase of the project are described in detail in this article.
Product Management Process
The Product Management process contains activities that are required to take the product (the mattress) from the production line and to ship it to the client. Products waiting for shipment are stored in the warehouse. Products are organized in pallets which are the smallest shipment and storage units. The products are categorized into families, which are understood as mattress types. There are twenty different product families. The transport of pallets among production lines, storage areas, and shipment areas is done by storekeepers. Storekeepers work 24 hours per day on three shifts except weekends.
The Product Management process involves the following types of activities:
-
Production refers to a storekeeper who takes a pallet from the production line;
-
Rest refers to a storekeeper who puts a pallet in the storage area;
-
Shipment approved refers to a storekeeper who prepares a pallet for shipping by putting it in a shipment area;
-
On fork refers to a storekeeper who transports a pallet between production line, storage, and shipment areas;
-
Shipped refers to an actually shipped pallet from a warehouse;
-
Deleted refers to the removing of a pallet.
Each activity that is performed by a storekeeper is recorded in the WMS. Before performing any activity, the storekeeper is obliged to scan a barcode available on every pallet. The WMS keeps track of a pallet life cycle and associates each scanning with the appropriate activity. For instance, once a pallet is scanned after production (Production activity), the next recorded activity must be On fork activity and Rest activity. By choosing the option Start shipment in the WMS user panel, storekeepers have the possibility to perform the Shipment approved and Shipped activities. The Deleted activity is performed only in exceptional situations.

Photo 2: Storekeeper scanning pallet labels
The de jure (assumed, prescribed) model assumes the sequential execution of activities in the following order: production, on fork, rest, on fork, shipment approved, and shipped. Optionally, if a pallet is shipped first to the external warehouse and then to the client, then the process has one additional shipment activity. The Delete activity can occur at any time.
Process Business Rules
The project aim was to verify if the actual operation of the warehouse is in line with the assumed procedures and guidelines. The list below presents only a subset of rules defined for the Product Management process by the Distribution and Warehouse Manager:
-
Conformance to model Process instances must follow the de jure model;
-
Work distribution All the three shifts should perform equal amount of work. Furthermore, storekeepers are divided into two groups: (1) taking pallets from production lines and (2) shipping pallets from a warehouse. Storekeepers from one group should not be involved in activities of the other group.
-
Quality assurance All pallets shipped to a client must be checked by the quality department;
-
First In First Out (FIFO) policy Products that were produced first must be shipped first. The FIFO rule must be satisfied for every mattress family. To conform to the FIFO rule, storekeepers must follow the recommendations that are generated by the WMS about which pallets must be handled next.

Photo 3: Dendro’s warehouse
Available Data
The Product Management process analysis was performed based on 554,745 events associated with 87,660 process instances, which were recorded over a timeframe of five months. The execution of these process instances involved 55 persons.
The following information is associated with each activity in the WMS event log: activity name, activity timestamp, name of the storekeeper executing the activity, identifier of the pallet being subject of the activity, mattress family, warehouse name, an optional stakeholder comment, and an optional pallet description.
Some information was only available for a subset of activities: storage area code (Rest activity), shipment area code (Shipment approved), recommended storage area code (Rest), and information whether the recommendation was followed by a stakeholder (Rest).
The following attributes were derived from other data available in the WMS database: stakeholder shift (day, afternoon, or night), information if a pallet was damaged, and information about whether the pallet was approved in terms of quality.
The maximum number of attributes associated with a particular activity is 12. The pallet identifier is used to group activity instances into process instances. Additionally each process instance is described with 10 attributes.
Process Mining Results
During the process mining analysis the four business rules described above were verified.
1. Conformance to Model
In Figure 1, de facto (actual) model discovered from the event log generated by Disco is presented. The presented model shows only the most frequent behavior. Overall, the model is in conformance with the assumed de jure model. The numbers assigned to activities and transitions indicate the number of process instances that appeared in the log. The darker the color of an activity and the thicker a transition line, the more frequently they were executed.

Figure 1: De facto model presenting the most frequent behavior
The de facto model presented in Figure 2 now captures the full behavior that was observed in the event log. The model shows that the execution of the process is far more complex than assumed in the de jure model. In particular, many additional transitions that are not included in the de jure model appear among various activities. For example, the transition from the Shipped activity to the Rest activity, the self-loops for activities On fork, Production, Shipment approved, Shipped, and Rest are not included in the de jure model.
The de facto model indicates that not only the Shipped activity, but also Rest, On fork, and Deleted activities are closing the process. If a Rest or On fork activity is the last activity in the process instance, then this means that these process instances are still running.

Figure 2: De facto model presenting the full frequent behavior captured in the event log
The number and distribution of process variants is presented in Figure 3. Despite the relatively simple and structured process, the number of generated variants was 160. Eleven variants were categorized as allowed and desired, and they accounted for 98,82% of all the executed process instances. Process instances associated with the remaining 148 variants accounted for only 1,18% of the process instance executions. The majority of those variants were evaluated to be exceptional but controlled. Some single process instances were categorized as suspicious and needed further investigation in the form of interviews with storekeepers or the Quality Department.

Figure 3: Distribution of process variants
Overall, the Product Management process execution has been evaluated to be highly standardized and repeatable.
2. Distribution of Work
Figure 4 presents the distribution of activities over the analyzed five months. One can easily observe a regularity of work. The warehouse does not operate on weekends, which is clearly visible as well. A larger break A corresponds to the holidays that take place in Poland at the beginning of May. The two peaks (B and C) refer to the automatic actualization of statuses of a large group of pallets performed by the WMS administrator (B) and an exceptionally large shipment of products (C).

Figure 4: Distribution of events over time
The table presented in Figure 5 was generated using the Task-to-Originator ProM Framework plugin. The rows of the table correspond to different storekeepers while the columns correspond to activity types. The numbers in the table cells indicate the number of times a particular type of activity was executed by a particular person.
It can be be easily noticed that storekeepers are divided into two separate groups: Storekeepers that perform Production activities (marked with red color) are usually not involved in Shipped activities (marked with green). However, there are some rare cases where a storekeeper performs both production and shipment activities (orange color), which violates the predefined business rules.

Figure 5: Activity to person assignment
Finally, Fluxicon Disco allows the quick comparison of work distribution among the three shifts (Figure 6). The differences in the number of activities among shifts are significant. While the first shift performs 37,54% of activities, the third shift handles only the 29,12% of the activities.

Figure 6: Distribution of work among shifts
3. Quality Assurance
By filtering based on activity attributes it is possible to extract those process instances from the event log that were not accepted by the Quality Department. Exactly 12 such process instances were identified.
In Figure 7, the model that describes the execution of these 12 process instances is presented. All the 12 pallets were not shipped to a client. Ten of them were destroyed by performing the Deleted activity. The remaining two process instances were still running when the event log was created (Rest activity). This confirms a high conformance to the quality assurance rule.

Figure 7: Process instances missing quality acceptance
In Figure 7, the performance characteristics of the process are also shown. The numbers correspond to the average time of transition executions. Typically, process instances are short and transitions are performed quite fast. Only the transition from Rest to Deleted activity takes longer. This is due to one process instance, where this transition took 2 days and 12 hours, therewith raising the average.
4. First In First Out
The Dotted Chart plugin available in the ProM Framework is used for the FIFO rule conformance testing. An example of a generated chart is shown in Figure 8. The graph was created for a group of mattresses coming from a one family. Each row in the dotted chart corresponds to exactly one process instance and each dot corresponds to an activity instance. Process instances are sorted from the top according to start time. The color of the dot is associated with the activity type: green corresponds to the Production activity while red corresponds to the last Shipped activity. All other activities were excluded from this analysis.
The company efforts for FIFO assurance are clearly visible. However, some deviations from the rule are also visible, as some earlier created pallets are shipped significantly later than others that were created afterwards. In fact, some patterns of red dots (the Shipped dots) are even running in the opposite directions of the green (the Production) dots. For better visibility, yellow lines were added in Figure 8 to highlight those opposite-direction patterns.
The reason for this is the organization of stands in the warehouse: The current organization of stands forces earlier produced product pallets to be placed deeper on the stand. Access to such products requires the removal of the later produced pallets, which usually is not performed (and would not be efficient). Also the WMS provides recommendations concerning the stands, not concerning the pallets. Thus, a perfect conformance of warehouse operations to the FIFO principle will never be achieved by the company.
This shows nicely that, while process mining helps in noticing some deviations or trends, one still needs to evaluate the results in the particular organizational context. For example, the level of conformance to FIFO that can be achieved is strongly influenced by the organization of stands in the warehouse. Any interpretation of positive or negative process mining results needs to be put in context with the help of domain knowledge.

Figure 8: Dotted chart for one of the mattress families
The non-conformance of storekeepers behavior to recommendations generated by the WMS has been recorded for 5231 activities performed within 3665 process instances (4% of all the process instances). Only Rest and Production activities are affected by missing adherence to these recommendations. In the case of 644 process instances that did not follow the recommendation it was justified, because those instances involved damaged pallets and damaged pallets must be transported to a special storage area. The remaining number of process instances that did not follow the recommended activities is not big but influences the conformance to the FIFO rule.
Take Aways
The presented analysis demonstrated business value coming from process mining applied to data already available in an organization. The mining was performed on data coming from the WMS as it is, without any modifications of the system or special preparations. Even an analysis of a relatively short and structured process can result in interesting insights, especially if a larger set of attributes describing activities and process instances is available. The analysis required active involvement of the Distribution and Warehouse Manager and occasional support from the companys IT department during the data preparation phase. No other resources were involved.
Some conformance testing questions raised by the company were not answered using existing conformance checking and process discovery methods. Those questions required the analysis of both control flow and social perspectives of the process. For instance, does the presence of the two particular storekeepers on the same shift contribute to an increase of damaged pallets? Recently proposed methods for multi-dimensional conformance analysis may be helpful here. Many conformance problems are not necessarily a consequence of storekeepers behavior or wrong work organization. Instead, the wrong configuration of the WMS might be an issue, for example, activities might be saved twice in the database. In such a case, process mining methods contribute to the testing of the information system itself.

Photo 4: Mattress production
Once the project is completed (the second phase of the project is still ongoing), Dendro Poland will set up a solution for on-demand process mining. Modifications made to the WMS will allow for an easy extraction of rich event logs encompassing data generated by Production Management, Material Management, Delivery and Shipment processes. Such logs can be later imported into Disco or the ProM Framework for detailed analysis performed by the Distribution and Warehouse Manager alone.

Anne Rozinat
Market, customers, and everything else
Anne knows how to mine a process like no other. She has conducted a large number of process mining projects with companies such as Philips Healthcare, Océ, ASML, Philips Consumer Lifestyle, and many others.