
In an earlier post, I have explained how you can mine a first process model and create an animation. In this post, I want to make you familiar with the log filters in ProM1.
What is a log filter?
Once you have created an event log and opened it in ProM, you may want to change it in various ways. Filtering is done for two main reasons: cleaning the data or narrowing down the analysis. Sometimes there are also technical reasons (just based on how some of the plug-ins in ProM work).
All in all, you can use log filters in ProM to change your event log in 4 ways:
-
Remove process instances (cases)
-
Add events
-
Remove events
-
Modify events
In the following, I’ll show you my two most important log filters – I use them in every project. There will also be a rough overview of other useful filters at the end of this post.
1. Adding artificial ‘start’ and ’end’ events
Let’s pick up the call center example again. Previously, we had discovered the following process model using the Fuzzy Miner.
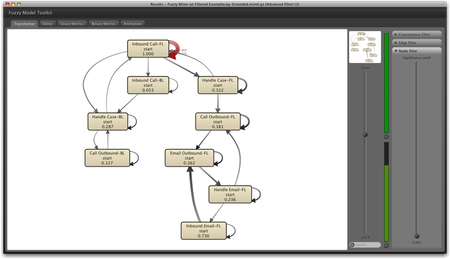
One thing that can be observed in the picture above is that it is hard to see where the process starts and where it ends. All of the activities are connected, and there is no clear beginning or end point.
To create a clear start and end point in your process models, you can use the so-called Add Artificial Start Task Log Filter and the Add Artificial End Task Log Filter. They are located in the ‘Advanced’ filter tab (see screenshot below).

To use these filters on your event log, you first have to select each of them in the list on the right and then press ‘add selected filter’. In the next screen, you can provide a custom name if you like2 , and then press ‘add new filter’. After that, the filter should appear in the ‘Log filter chain’ on the left (see screenshot above).
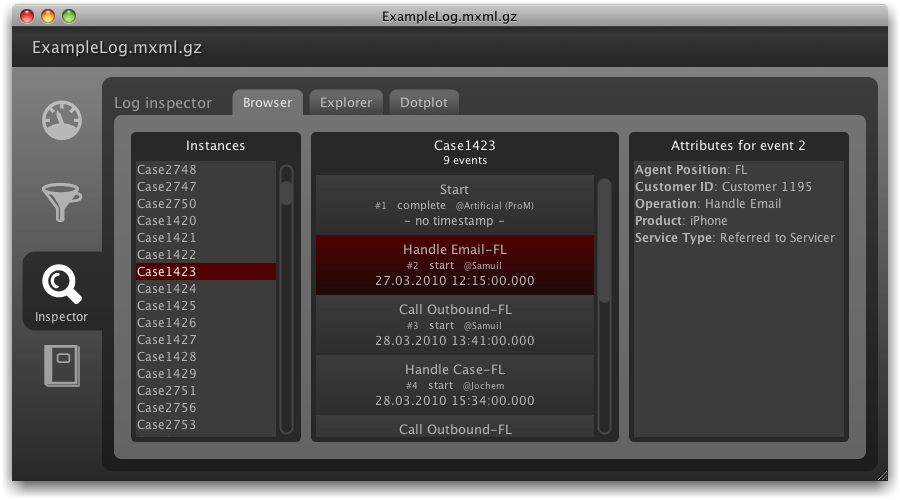
The effect of the log filter can be directly verified in the log inspector. The event log is exactly the same, just that the artificial ‘Start’ event has been inserted at the very beginning in each trace (see screenshot below). Similarly, the ‘End’ event is inserted after the last event in the sequence.
If we now discover a process model based on the filtered log, we get the following process model:
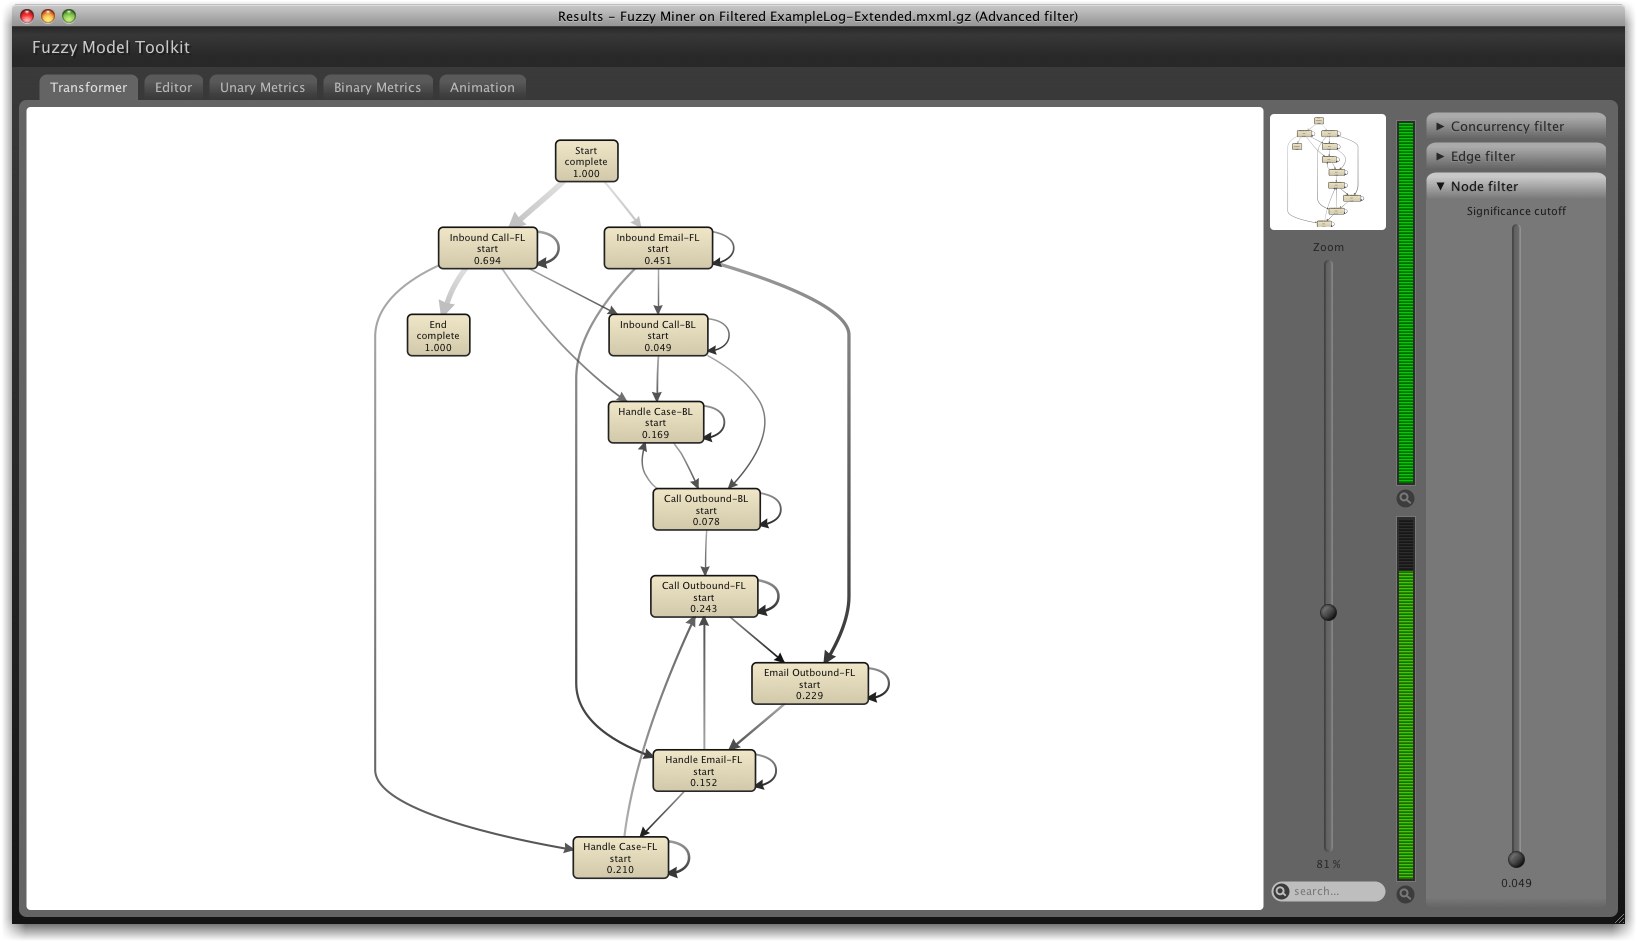
The main path of the process is now clearly visible based on the thickness of the arcs: Most process instances are handled by an incoming call at the front line and are then directly completed.
Be aware that, in fact, some of the mining algorithms (such as the Heuristic miner) assume that there is an identical start and end event for each case (otherwise the quality of the result may be reduced). So, it is strongly advisable to add these start and end events in most situations3 .
2. Filtering cases based on ‘start’ and ’end’ events
Now, this sounds very similar but in fact is quite the opposite: Instead of adding artificial ‘start’ and ’end’ events we select only those process instances that start and/or end with particular activities in the first place.
In many situations, one gets a data extract of the complete process logging in a particular time frame. So, the event log most likely contains some process instances that are incomplete because they were started before the data extract begins, or they were not yet finished when the data extract stops. So, to clean up your data you should remove those incomplete process instances from the log.
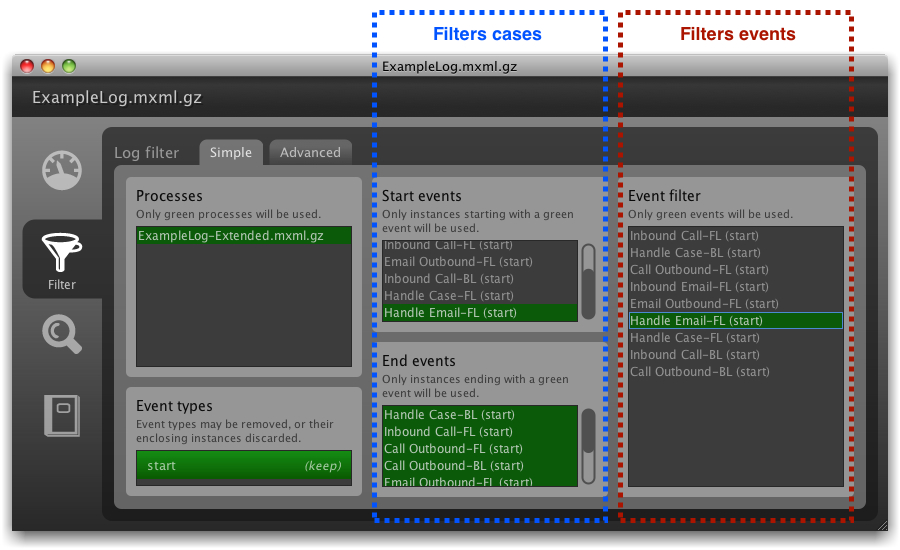
This is exactly what the simple log filter can do. In the middle area (see screenshot below), you can determine which are the legal start and end events for your process and throw away all cases that do not fulfill this filtering criteria.
Again, you can observe and verify your current filter settings by changing to the inspector tab in the log window.
In the call center example we have extracted complete process instances from the data base: We had only retrieved data for those service requests that were started within one particular month. Therefore, all ‘start’ events that are found in the log do really correspond to the start of the process.
Nevertheless, looking at the list of start events in the simple log filter UI above, we can see that the process did not always start with an incoming phone call or an incoming email (as expected). This indicates that agents are not always re-using existing service requests but give out new IDs in the middle of the process. It is important for the service quality that all activities are logged with the same service ID because it ensures that agents in follow-up activities have all the necessary information at hand.
For example, the activity ‘Handle Email-FL’ appears in the list of start events. However, when an email is received by the call center through the web form of the company, then a service request ID is automatically assigned. The existing service request number should be re-used.
We can use the start event filter to narrow down our analysis to these special cases. Furthermore, we want to focus only on the activity ‘Handle Email-FL’ in order to find out which agents are making this mistake. To remove all other activities from the event log, we deselect them in the right part the filter (see screenshot above).
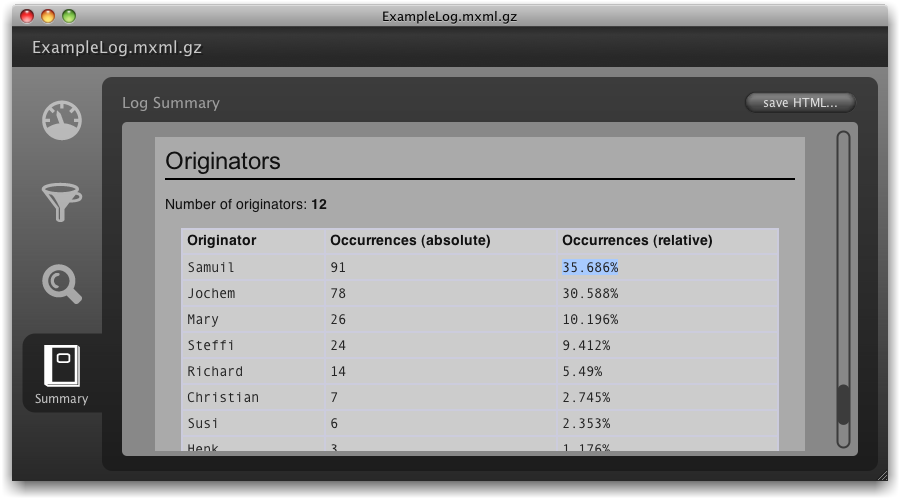
We can view the log summary for the filtered log by changing to the Summary tab of the log dialog (see screenshot above). Scrolling to the Originators category, we can see that the agents Samuil and Jochem most often create new service IDs when they handle incoming emails. We can now give them targeted training and explain them why it is important to re-use existing service numbers.
The example shows that just using simple filtering methods, one can already answer certain questions about a process and find quality problems.
Other log filters in ProM
There are several other filter plug-ins in ProM. Here are a few that I use:
-
Remap Element Log filter. This one is really useful and quite powerful. You can remove or change the name of events based on regular expression matching. This is handy if you have several low-level events that you would like to project on the same higher-level activity. The preview shows you the effect of your matching rules, so you can check whether you got the expressions right.
-
Duplicate Task filter. This filter removes direct repetitions of events with the same name. You can use it if you need to get rid of duplications, or if you have used the Remap filter before to combine several lower-level activities into one.
-
Repetitions-to-Activity filter. If you have an event log that has only a single timestamp for each activity, most of the performance analysis plug-ins don’t work because they expect both ‘start’ and ‘complete’ events for each activity. This filter inserts ‘start’ and ‘complete’ events and, therefore, makes it possible to collect performance metrics for such logs.
-
Attribute value filter. Keeps only events that have a certain attribute value. It does not always work reliably, so make sure to check the effect of the filter in the Inspector.
-
Process Instance Length filter. Sometimes you want to focus on those cases that needed more activities than others to complete (for example to understand why rework was necessary). This filter lets you specify which process instances to keep based on a threshold on the number of events in the sequence.
-
Process Instance Frequency filter. If you use the Grouped MXML log (same sequence) export function, then you can see how many process execution variants are in the event log. After loading such a “grouped” log, you can then apply this filter to focus on the most frequent (e.g., 80%) execution variants only.
-
Enhanced Event Log filter. Both events and process instances can be filtered based on an activity-based frequency percentage threshold. This is useful if there are hundreds of different events to, for example, focus only on activities that occur in most of the cases.
I hope this gives an overview and a starting point for how to use the log filters in ProM. Just like ProM itself, the filters have grown over time based on specific needs. So, you may very well end up missing a certain type of filtering functionality.
Which filters do you use most often? Which ones have you missed and how did you deal with it? Let us know in the comments!
-
We generally recommend to use ProM 5 because of its stability and functionality. The log filters are in fact a good example where ProM 6 is not fully functional yet. If you want to know where ProM is heading in the future, you can learn more about the advantages of ProM 6 here. ↩︎
-
I choose ‘Start’ and ‘End’ instead of the somewhat lengthy ‘Artificial Start Task’ and ‘Artificial End Task’. ↩︎
-
You can avoid redoing the filtering multiple times if you choose Exports -> Filtered log -> Efficient MXML.GZ Export from the menu and save the filtered log. ↩︎

Anne Rozinat
Market, customers, and everything else
Anne knows how to mine a process like no other. She has conducted a large number of process mining projects with companies such as Philips Healthcare, Océ, ASML, Philips Consumer Lifestyle, and many others.